US INFLATION: CPI Seen Picking Up In June, Core Goods Eyed For Early Tariff Hit
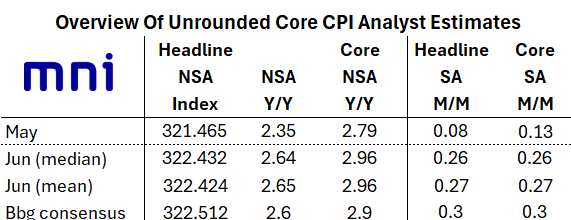
June CPI is the highlight of next week's US data slate, with MNI's early roundup of analyst expectations showing an anticipated acceleration in the main measures of inflation. Both core and headline CPI are seen rising to the mid 0.20s% M/M, from May's readings of 0.13% for core and 0.08% for headline.
- Such outturns would mean the strongest M/M headline CPI since January, with core continuing to range between 0.0-0.3% for a 5th consecutive month. They would also bring the Y/Y core reading to 2.9% or 3.0%, with headline at 2.6% or 2.7% (both would be 4-month highs).
- The first area of focus will be on core goods prices, with the impact of import tariffs expected to become more acute as the summer progresses: core goods are seen up from May's flat M/M reading to closer to 0.2%, with tariff-sensitive categories such as apparel and recreational goods seeing a pickup, offset by a drag from used vehicles.
- Core services are seen picking up modestly from 0.2% M/M in May to closer to 0.3%, with May's relatively tame housing inflation steady-to-higher. "Supercore" (core services ex-housing) is expected to rise from May's surprisingly low sub-0.1% M/M print to closer to 0.3%, as airfares and medical care services prices regain traction.
- It's unlikely that a downside surprise would persuade the Federal Reserve to seriously consider cutting rates in July, given the expected pickup in tariff-related prices in coming months, but it would certainly help lay the groundwork for a resumption of easing in September.
Want to read more?
Find more articles and bullets on these widgets:
Historical bullets
US STOCKS: Late Equities Roundup: Support Wanes Late
- Support for stocks waned in late Wednesday trade, no obvious headline driver as major indexes traded lower. Treasury futures did extend late session highs of 110-23 (+16.5), however, through initial technical resistance (110-19+/20+ 50-day EMA / Jun 11 High).
- Stocks had quickly pared post-CPI data highs amid cautious optimism after several US/China trade related headlines regarding rare earth supply chains rather than tariffs aired this morning. Currently, the DJIA trades up 54.44 points (0.13%) at 43046.38, S&P E-Minis down 12 points (-0.2%) at 6057.75, Nasdaq down 71.7 points (-0.4%) at 19766.81.
- Energy and Health Care sectors outperforming in late trade, while Materials, Consumer Staples and Communication Services sectors continued to underperform.
- Leading gainers included: GE Vernova +3.11%, Broadcom +2.94%, Palantir Technologies +2.70% and First Solar +2.45% while CVS Health +2.05%, Insulet +1.40%, McKesson +1.32% and UnitedHealth Group +1.26%.
- Laggers included Intel Corp -6.77%, Nucor Corp -6.18%, ON Semiconductor -4.48% and Skyworks Solutions -3.08% while Delta Air Lines -4.90%, United Airlines -4.86% and Lockheed Martin -4.57%. Separately, Old Dominion Freight Line -3.38%, Ross Stores -3.23% and Best Buy Co -3.14%.
US DATA: Federal Deficit Running In Line With Bessent's 6.5-6.7% of GDP Est
The federal budget deficit came in a little higher than expected in May, at $316.0B (vs $314.0B consensus and as estimated by the CBO on Monday), per Treasury's monthly statement. That brought the FY2025 fiscal year (Oct-Sep) to date deficit to $1.365T, up $160B from the equivalent period in 2024 and, through the first 8 months, is set for the highest for a full FY in nominal terms since 2021.
- MNI estimates the 12-month running deficit at around 6.6% of GDP, which is squarely in the middle of Treasury Sec Bessent's estimated 6.5-6.7% of GDP that he mentioned at a congressional committee hearing today.
- Cumulative FY expenditures came in at a new record $4.85T (+7.9% Y/Y) vs revenue of $3.48T (+5.9% Y/Y). Both are set to reach all-time highs this year.
- The 12-month rolling deficit (which helps mitigate timing and other seasonal issues in the monthly comparisons) of $1.99T represents the third consecutive decline after the recent $2.15T peak in February. The 12-month running total of revenue likewise hit a new all-time high $5.11T, but expenditure continued to rise $7.11T (the all-time-high set in March 2021 at $7.62T).
- It would also represent a widening after 6.4% in FY2024 and 6.2% in FY2023.


USDJPY TECHS: Corrective Cycle
- RES 4: 150.49 High Apr 2
- RES 3: 149.28 High Apr 3
- RES 2: 147.67/148.65 High May 14 / 12 and a reversal trigger
- RES 1: 145.46/146.28 High Jun 11 / High May 29 and key resistance
- PRICE: 144.62 @ 16:32 BST Jun 11
- SUP 1: 142.12 Low May 27 and a key support
- SUP 2: 141.96 76.4% retracement of the Apr 22 - May 12 bull leg
- SUP 3: 139.89 Low Apr 22 and a bear trigger
- SUP 4: 138.82 1.50 proj of the Feb 12 - Mar 11 - 28 price swing
A short-term bull cycle in USDJPY remains in play - for now. The latest recovery is considered corrective and the trend condition is bearish. A resumption of weakness would open 142.12, the May 27 low. A clear break of this level would confirm a continuation of the bear leg and open 139.89, the Apr 22 low. MA studies remain in a clear bear-mode position too, highlighting a dominant downtrend. Key short-term resistance is 146.28, the May 29 high.