US DATA: Capital Goods Imports Continue Protectionist Boost [1/2]
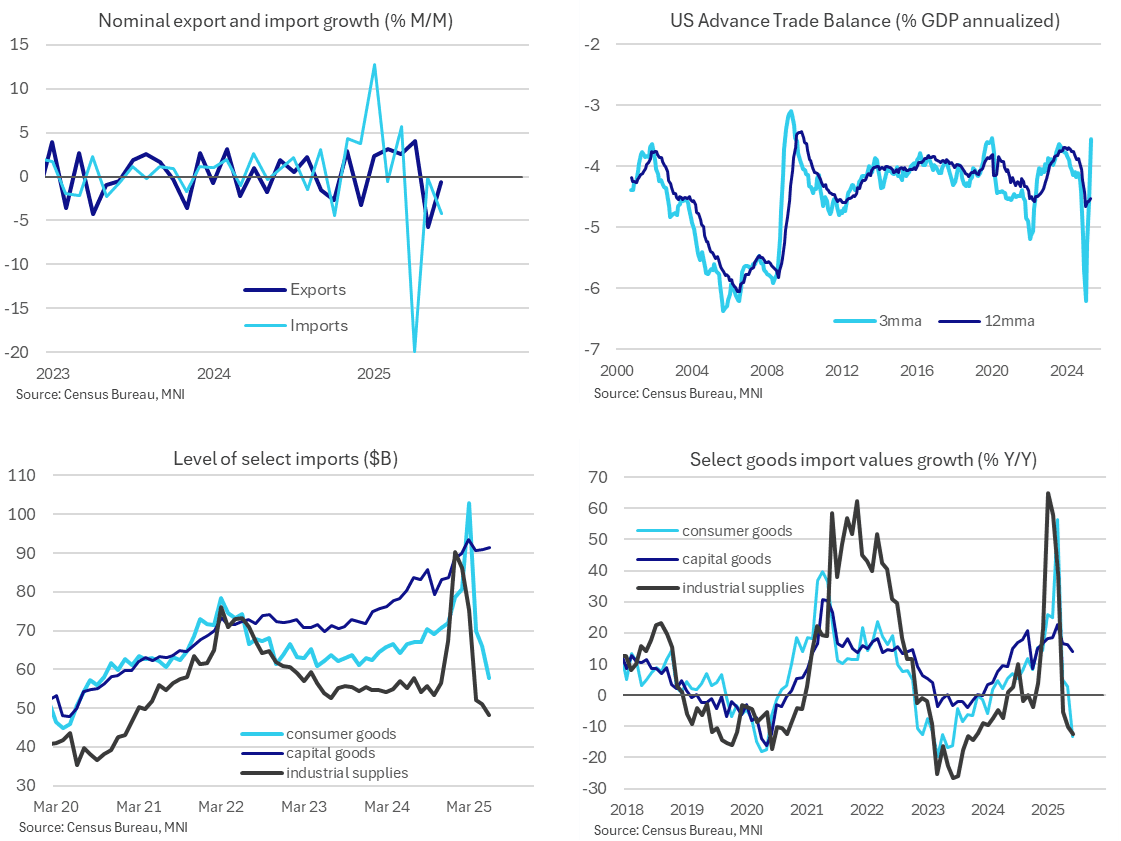
- The goods trade deficit was smaller than expected in June at $86bn (cons $98bn) after $96.6bn in May.
- It appears to be further payback from the huge deficits of Dec and Q1 driven by tariff front-running, primarily gold and then pharmaceutical products.
- It’s useful simply to compare recent levels: the $86bn in June leaves an average of $89bn in Q2 since the actual announcement and then various alterations to reciprocal tariffs, after $155bn in Q1, $109bn in 4Q24 (as it started to show the impact of gold arbitrage) and $102bn in 3Q24.
- That’s a goods deficit worth 3.6% GDP in Q2 after 6.2% in Q1, 4.4% in Q4 and 4.2% in Q3.
- Nominal exports were largely flat in June at -0.6% M/M after swings of -5.7% and +4.1% in the previous two months, with offsetting forces from a bounce in capital goods (+4.7%) and further drop in industrial supplies (-8.1%).
- Imports continued to be the major driver meanwhile, falling a nominal -4.2% M/M in June after -0.1% in May and a historically large -20% M/M in April.
- It left the level of imports of $264bn at the lowest since Mar 2024, below the $272bn averaged in 2024 for example before surging to $333bn in Q1.
- The main culprits for this return to pre-tariff levels are consumer goods ($57.7bn in June vs $67bn in 2024), industrial supplies ($48.3bn vs $56bn) and autos ($36bn vs $39.5bn). One area that bucks this trend, and continues to show signs of impact from more isolationist trade policy, is capital goods imports which rose further to $91.5bn (vs $80bn in 2024).
- A reminder that when discussing this broad categories, industrial supplies includes both monetary gold and petroleum whilst consumer goods include pharmaceutical products.
Want to read more?
Find more articles and bullets on these widgets:
Historical bullets
US FISCAL: Available "Extraordinary" Measures To Ward Off X-Date Pick Up
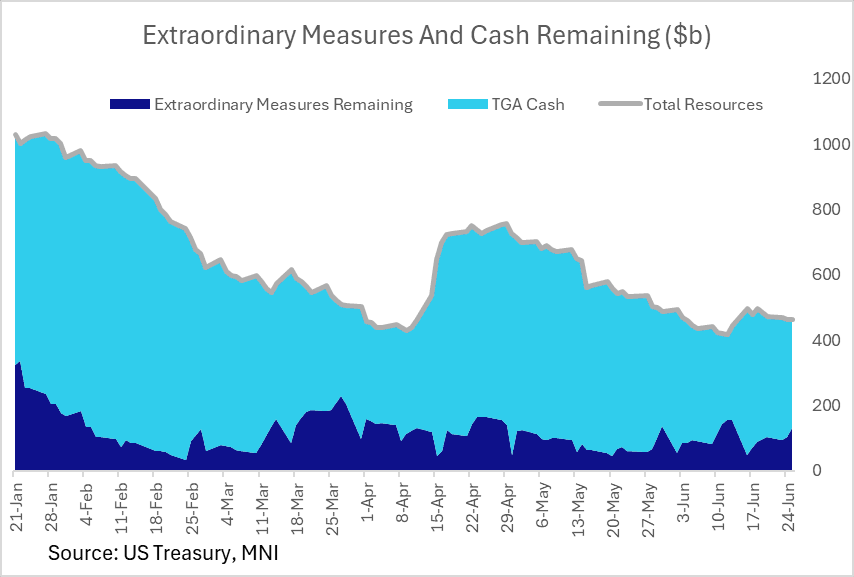
Treasury reported Friday that as of Jun 25 it had $130B in remaining "extraordinary" measures (of a total $378B available) to ward off an "x-date" of running out of resources before defaulting. That's the highest in 2 weeks.
- Combined with $334B cash as of Jun 25 (after a bit of a buildup after the mid-June tax deadline), that's a total of roughly $465B in total resources available.
- We noted earlier this week that Treasury told Congress that it was required to extend its debt issuance suspension period from Jun 27 to Jul 24, in effect prolonging the use of extraordinary measures while we await a resolution to the debt limit impasse, probably through the fiscal legislation currently going through Congress.
- Realistically, fiscal dynamics so far this year point to potential for Treasury to get into September without running out of cash + extraordinary measures. That seems to be the broad market expectation.
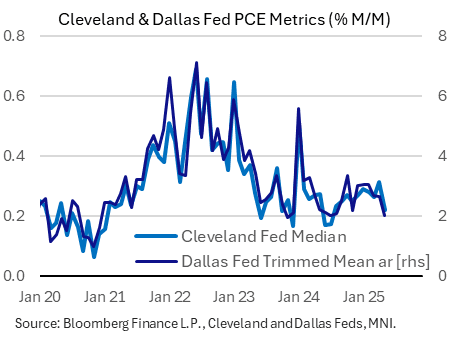
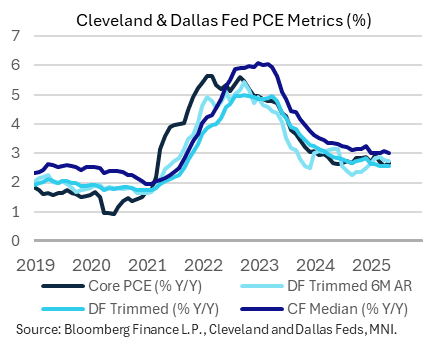
US DATA: Cleveland, Dallas Fed PCE Medians Show Progress But Still Above-Target
The Cleveland and Dallas Fed's median PCE metrics showed a notable drop in May. All indices suggest PCE inflation running above 2%, and higher than the actual core and headline PCE measures, but pressures appear to have cooled from a pickup in the early months of the year.
- The Cleveland Fed's median PCE measure came in at 0.22% M/M, a 10-month low after April's 15-month high 0.31%. This left median PCE at 3.01% on a Y/Y basis, down from 3.06% prior for a the joint-lowest (with Feb) since September 2021.
- The Dallas Fed's annualized median rate fell to 2.01%, from 2.65% prior for a 10-month low. The 6-month annualized rate edged lower to 2.74% (2.76% prior), a 4-month low, with the Y/Y rate ticking down to 2.55% from 2.56%, echoing the Cleveland Fed for the lowest reading since September 2021.
USDCAD TECHS: Pivot Resistance Remains Intact
- RES 4: 1.4111 High Apr 4
- RES 3: 1.4016 High May 12 and 13 and a key resistance
- RES 2: 1.3920 High May 21
- RES 1: 1.2710/3803 20- and 50-day EMA values
- PRICE: 1.3658 @ 16:23 BST Jun 27
- SUP 1: 1.3618 Low Jun 26
- SUP 2: 1.3540 Low Jun 16 and the bear trigger
- SUP 3: 1.3503 1.618 proj of the Feb 3 - 14 - Mar 4 price swing
- SUP 4: 1.3473 Low Oct 2 2024
USDCAD has pulled back from its recent highs. The primary downtrend remains intact and short-term gains appear to have been corrective. Key support and the bear trigger has been defined at 1.3540, the Jun 16 low. Clearance of this price point would resume the downtrend. Any reversal higher would instead signal scope for a stronger retracement. Pivot resistance to monitor is at the 50-day EMA, at 1.3803.