ASIA STOCKS: Big Inflow yesterday for Taiwan as India Sees Outflows
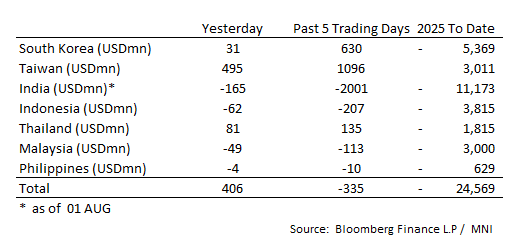
- South Korea: Recorded inflows of +$31m yesterday, bringing the 5-day total to +$630m. 2025 to date flows are -$5,369. The 5-day average is +$126m, the 20-day average is +$191m and the 100-day average of -$10m.
- Taiwan: Had inflows of +$495m yesterday, with total inflows of +$1,096 m over the past 5 days. YTD flows are positive at +$3,011. The 5-day average is +$219m, the 20-day average of +$312m and the 100-day average of +$150m.
- India: Had outflows of -$165m as of the 1st, with total outflows of -$2,001m over the past 5 days. YTD flows are negative -$11,173m. The 5-day average is -$400m, the 20-day average of -$142m and the 100-day average of +$35m.
- Indonesia: Had outflows of -$62m yesterday, with total outflows of -$207m over the prior five days. YTD flows are negative -$3,815m. The 5-day average is -$41m, the 20-day average -$20m and the 100-day average -$31m.
- Thailand: Recorded inflows of +$81m yesterday, with inflows totaling +$135m over the past 5 days. YTD flows are negative at -$1,815m. The 5-day average is +$27m, the 20-day average of +$28m and the 100-day average of -$12m.
- Malaysia: Recorded outflows as of -$49m yesterday, totaling -$113m over the past 5 days. YTD flows are negative at -$3,000m. The 5-day average is -$23m, the 20-day average of -$13m and the 100-day average of -$17m.
- Philippines: Recorded outflows of -$4m yesterday, with net outflows of -$10m over the past 5 days. YTD flows are negative at -$629m. The 5-day average is -$2m, the 20-day average of -$4m the 100-day average of -$4m.
Want to read more?
Find more articles and bullets on these widgets:
Historical bullets
USDCAD TECHS: Trend Outlook Remains Bearish
- RES 4: 1.4111 High Apr 4
- RES 3: 1.4016 High May 12 and 13 and a key resistance
- RES 2: 1.3920 High May 21
- RES 1: 1.3674/3776 20- and 50-day EMA values
- PRICE: 1.3607 @ 16:12 BST Jul 4
- SUP 1: 1.3557 Low Jul 03
- SUP 2: 1.3540 Low Jun 16 and the bear trigger
- SUP 3: 1.3503 1.618 proj of the Feb 3 - 14 - Mar 4 price swing
- SUP 4: 1.3473 Low Oct 2 2024
The trend needle in USDCAD points south and this week’s move down reinforces current conditions. S/T gains between Jun 16 - 23 appear to have been corrective. Key support and the bear trigger is 1.3540, Jun 16 low. Clearance of this level would resume the downtrend and open 1.3503, a Fibonacci projection. Pivot resistance is at the 50-day EMA, at 1.3776. A clear break of this average would signal scope for a stronger recovery.
AUDUSD TECHS: Bull Cycle Remains In Play
- RES 4: 0.6700 76.4% retracement of the Sep 30 ‘24 - Apr 9 bear leg
- RES 3: 0.6688 High Nov 7 ‘24
- RES 2: 0.6603 High Nov 11 ‘24
- RES 1: 0.6590 High Jul 01
- PRICE: 0.6548 @ 16:05 BST Jul 04
- SUP 1: 0.6521 20-day EMA
- SUP 2: 0.6468/6373 50-day EMA / Low Jun 23 and a reversal trigger
- SUP 3: 0.6357 Low May 12
- SUP 4: 0.6275 Low Apr 14
The trend set-up in AUDUSD remains bullish and the pair is holding on to its recent gains. The latest break higher maintains the bullish price sequence of higher highs and higher lows, the definition of an uptrend. Moving average studies are in a bull-mode position, highlighting a dominant uptrend. Sights are on 0.6603 next, the Nov 11 2024 high. Key short-term support has been defined at 0.6373, the Jun 23 low.
EURJPY TECHS: Northbound
- RES 4: 171.88 High Jul 19 ‘24
- RES 3: 171.28 1.382 proj of the Feb 28 - Mar 18 - Apr 7 price swing
- RES 2: 171.09 High Jul 23 ‘24
- RES 1: 170.61 High Jul 03
- PRICE: 170.22 @ 16:04 BST Jul 04
- SUP 1: 169.04 Low Jul 02
- SUP 2: 167.87 20-day EMA
- SUP 3: 167.13 Low Jun 20
- SUP 4: 165.66 50-day EMA
EURJPY traded higher on Thursday resulting in a print above 170.47, the 76.4% retracement of the Jul 11 - Aug 5 sell-off. A clear break of this price point would strengthen bullish conditions and signal scope for extension. This would open 170.28 next, a Fibonacci projection. The trend is overbought, a pullback would unwind this condition. Support to watch lies at 167.87, the 20-day EMA.