US STOCKS: Big Bounce As Equity Traders Focus On Rate Cuts, Ignore Growth Angst
The ESU5 overnight range was 6279.25 - 6370.00, Asia is currently trading around 6362. The ESU5 contract found good demand around the 6250 area, its first level of support and bounced strongly overnight. The market seems to be concentrating on the potential rate cuts coming and ignoring the worries about growth that would make the cuts possible for now. This morning has seen US futures open a little higher, ESU5 +0.11%, NQU5 +0.15%. The broader market also saw good demand across the board, Dow Transports +1.06% , Regional US Banks +1.31%, Russell +2.10%. Price bounced strongly off its first support around 6200/6250, I suspect bounces back towards 6350/6400 should now initially find sellers. A break below 6200 is needed to potentially signal a deeper correction back to the 5900/6000 area.
- Lance Roberts(RIA) - “The market appears vulnerable to additional downside pressure soon, especially if upcoming economic data (like ISM Services and productivity reports) disappoint. However, unless selling accelerates through key support at the 50-day moving average(6150), this pullback could ultimately serve as a reset for an overbought market.”
- Michael A. Arouet on X: “Eye-opening chart, S&P 490 has had no earnings growth since 2022. Is the economy really strong?” See Fig.1 Below.
- David Rosenberg on X: ”The virtual stalling-out in payroll growth in the past three months has been a recession predictor with 100% accuracy over the past six decades. Score a win for Bowman and Waller, whose crystal balls are clearer than the rest of the FOMC pack."
- ISABELNET on X: “Systematic strategies have increased their equity exposure to the 84th percentile, while discretionary investors have lowered theirs to the 30th percentile, highlighting a significant divergence.”
- Bloomberg - “S&P 500 earnings are crushing 2Q expectations -- up 9.1%, triple the preseason forecast and the strongest beat rate since 2021. But now, with stocks near all-time highs, the question is whether this recovery still has legs. Profit growth, which peaked at about 13%, is expected to decelerate to 6.8% in 3Q and 6.7% in 4Q and then pick up again into early 2026. Management sentiment is at an eight-year high, yet guidance tells a more cautious story with concerns about tariffs and rising costs.”
Fig 1: S&P 490 Vs Top 10
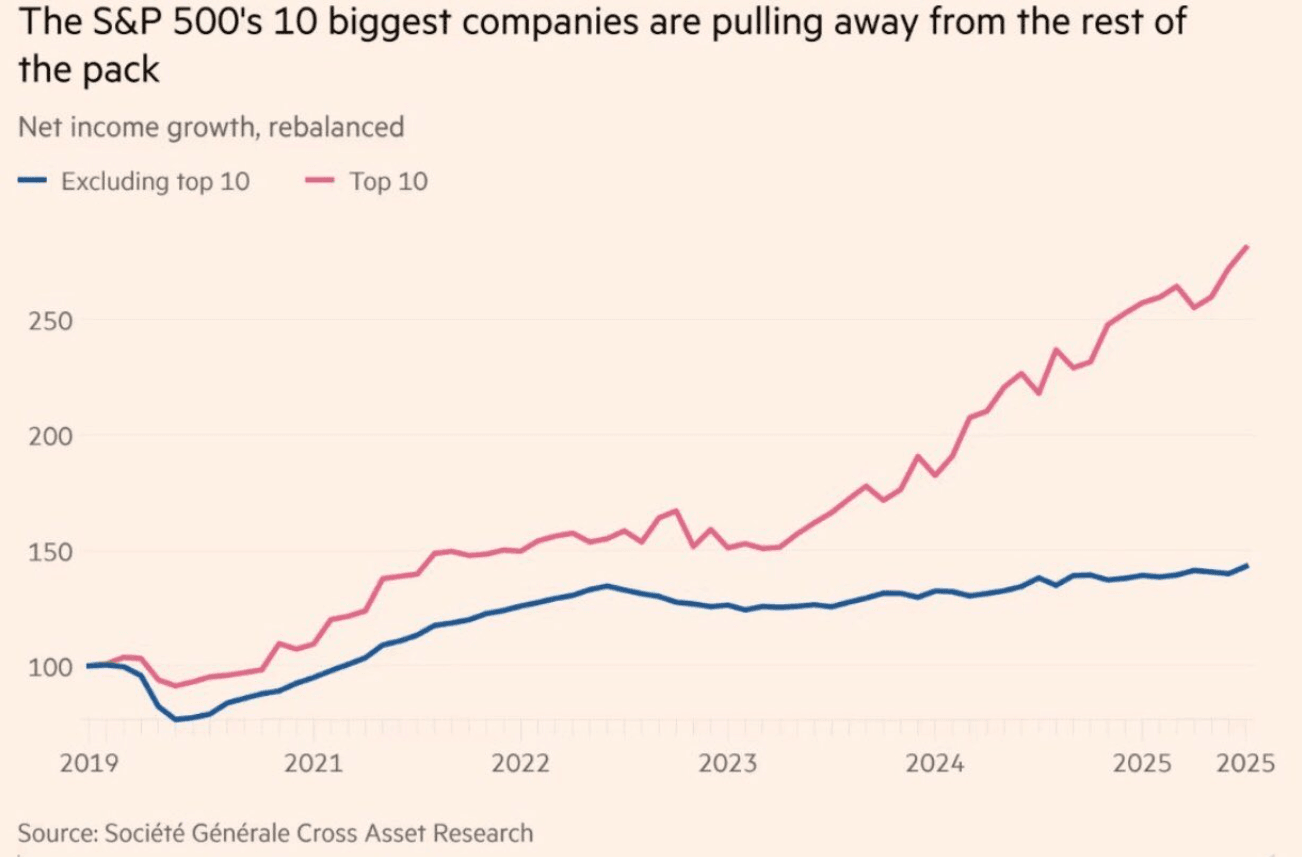
Source: MNI - Market News/@MichaelAArouet/SocGen
Want to read more?
Find more articles and bullets on these widgets:
Historical bullets
USDCAD TECHS: Trend Outlook Remains Bearish
- RES 4: 1.4111 High Apr 4
- RES 3: 1.4016 High May 12 and 13 and a key resistance
- RES 2: 1.3920 High May 21
- RES 1: 1.3674/3776 20- and 50-day EMA values
- PRICE: 1.3607 @ 16:12 BST Jul 4
- SUP 1: 1.3557 Low Jul 03
- SUP 2: 1.3540 Low Jun 16 and the bear trigger
- SUP 3: 1.3503 1.618 proj of the Feb 3 - 14 - Mar 4 price swing
- SUP 4: 1.3473 Low Oct 2 2024
The trend needle in USDCAD points south and this week’s move down reinforces current conditions. S/T gains between Jun 16 - 23 appear to have been corrective. Key support and the bear trigger is 1.3540, Jun 16 low. Clearance of this level would resume the downtrend and open 1.3503, a Fibonacci projection. Pivot resistance is at the 50-day EMA, at 1.3776. A clear break of this average would signal scope for a stronger recovery.
AUDUSD TECHS: Bull Cycle Remains In Play
- RES 4: 0.6700 76.4% retracement of the Sep 30 ‘24 - Apr 9 bear leg
- RES 3: 0.6688 High Nov 7 ‘24
- RES 2: 0.6603 High Nov 11 ‘24
- RES 1: 0.6590 High Jul 01
- PRICE: 0.6548 @ 16:05 BST Jul 04
- SUP 1: 0.6521 20-day EMA
- SUP 2: 0.6468/6373 50-day EMA / Low Jun 23 and a reversal trigger
- SUP 3: 0.6357 Low May 12
- SUP 4: 0.6275 Low Apr 14
The trend set-up in AUDUSD remains bullish and the pair is holding on to its recent gains. The latest break higher maintains the bullish price sequence of higher highs and higher lows, the definition of an uptrend. Moving average studies are in a bull-mode position, highlighting a dominant uptrend. Sights are on 0.6603 next, the Nov 11 2024 high. Key short-term support has been defined at 0.6373, the Jun 23 low.
EURJPY TECHS: Northbound
- RES 4: 171.88 High Jul 19 ‘24
- RES 3: 171.28 1.382 proj of the Feb 28 - Mar 18 - Apr 7 price swing
- RES 2: 171.09 High Jul 23 ‘24
- RES 1: 170.61 High Jul 03
- PRICE: 170.22 @ 16:04 BST Jul 04
- SUP 1: 169.04 Low Jul 02
- SUP 2: 167.87 20-day EMA
- SUP 3: 167.13 Low Jun 20
- SUP 4: 165.66 50-day EMA
EURJPY traded higher on Thursday resulting in a print above 170.47, the 76.4% retracement of the Jul 11 - Aug 5 sell-off. A clear break of this price point would strengthen bullish conditions and signal scope for extension. This would open 170.28 next, a Fibonacci projection. The trend is overbought, a pullback would unwind this condition. Support to watch lies at 167.87, the 20-day EMA.