AUSTRALIA DATA: Better Headline GDP, But Slowing Private Demand Contribution
The headline GDP outcomes for Q4 were firm to slightly better than market forecasts. The q/q print was 0.8%, in line with consensus expectations, but Q3 was revised up to a 0.5% gain (original estimate was a 0.4% rise). This helped push the y/y outcome to 2.6%, versus the 2.3% market forecast (which was also the RBA's projection) and prior 2.1% rise. The 2.6%y/y print was the strongest Q1 2023. At face value this keeps March RBA tightening risks in play, as the central bank may view it needs to hike more to curb growth momentum, which has been bumping up against supply constraints. Still, the detail showed slowing in private domestic demand versus Q3 outcomes, which may give the central bank comfort some sources of inflation (from the demand side) could moderate.
- The chart below shows q/q GDP growth, along with the contributions from the private and public demand side. The private demand contribution eased to 0.3ppts, from 0.9ppts in Q3. The public contribution slowed to 0.3ppts from 0.4ppts in Q3. The change in inventories were a big swing factor, contributing +0.4ppts, after dragging -0.5ppts in Q3. Net exports were unchanged at a -0.1ppts drag.
- Household consumption rose 0.3% in the quarter after a 0.5% gain in Q3. In y/y terms spending eased a touch to 2.4% from 2.6% in Q3. The ABS noted: "Discretionary spending rose 0.4 per cent reflecting the expansion of Black Friday sales and strong attendance at sporting and concert events. Spending on essential goods and services grew 0.2 per cent in the quarter." The household savings rate continued to trend higher to 6.9% from 6.1%.
- Private investment rose 0.7%q/q, after a 3.2% surge in Q3. The ABS notes: "Machinery and equipment (M&E) fell 2.0 per cent following a 7.8 per cent increase in the September quarter. ‘Investment in data centres and aircrafts was maintained at high levels. Investment in M&E was 4.0 per cent higher through the year.’ Ms Kim said. Housing investment contributed 0.1 percentage points to GDP growth, with a rise in construction of apartments and high real estate turnover. "
Fig 1: Australia GDP Q/Q & Private and Public Contributions To Growth
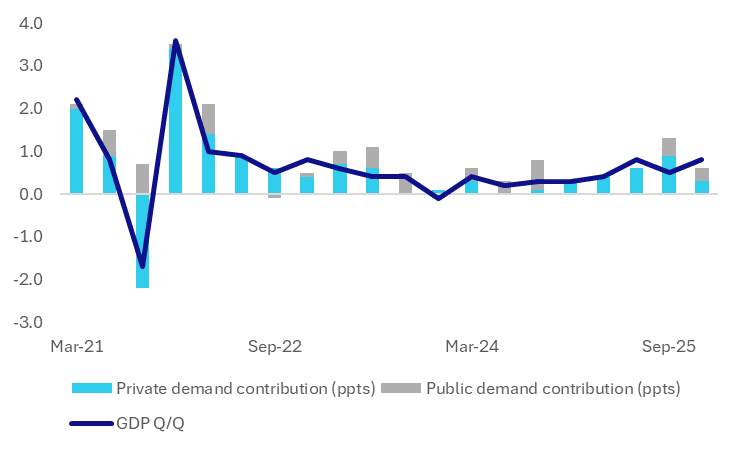
Source: ABS/MNI
Want to read more?
Find more articles and bullets on these widgets:
Historical bullets
STIR: RBA-Dated OIS Pricing Has Firmed Sharply Since Dec’s Jobs Data
RBA-dated OIS pricing has firmed by around 11–21bps across meetings since the release of December’s stronger-than-expected labour market data on 22 January.
- Employment rose by 65.2k m/m in December (vs +27k expected), following a revised -28.7k in November. The unemployment rate fell to 4.1% (vs 4.3% expected) from 4.3%.
- Last week’s firmer-than-expected Q4 trimmed mean CPI print (3.4% y/y vs 3.3% expected) reinforced the repricing ahead of tomorrow’s RBA policy decision.
- OIS now reflects materially tighter policy expectations across the curve.
- A 25bp hike tomorrow is priced at a 77% probability (up from 32% pre-jobs), with cumulative tightening probability of 166% by June (vs 88% pre-jobs) and 229% by December 2026 (vs 152% pre-jobs).
Figure 1: RBA-Dated OIS – Current Vs. Pre-Jobs
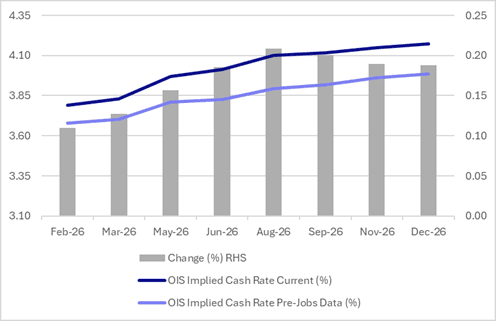
Source: Bloomberg Finance LP / MNI
MNI: CHINA JAN RATINGDOG MANUFACTURING PMI 50.3 VS 50.1 IN DEC
- CHINA JAN RATINGDOG MANUFACTURING PMI 50.3 VS 50.1 IN DEC
US TSYS: Curves Steepen Further; 2s10s Testing 2021 Levels
A generally weak start to the Asia trading week sees equity bourses mixed and bond yields ticking higher. The move lower in metals Friday was huge and today's influences is likely impacted by re-positioning and liquidity requirements for funds, possibly part of the driver for higher yields in the Asia trading day.
Cash is up in yield +0.6bps to 2.0bps with the long end underperforming as the curve steepens further above 1-Yr highs. The current environment remains challenging given a White House Friendly new Chairman (lower rates) who wants to reduce the balance sheet (steeper curves). This remains the speculation, and 2s10s could test +80 in the coming days.
- The 2-Yr is flat at 3.529%
- The 5-Yr is up +1.2bps at 3.802%
- The 10-Yr is up +1.8bps at 4.257%
- The 30-Yr is up +2bps at 4.894%
Futures are modestly down across maturities with the 10-Yr down -02 at 111-24+, retaining its position below all major moving averages.
Futures are pointing down modestly for US equities and as pressure on gold / silver etc continues, the push pull of liquidity vs risk sentiment will make directional calls for bonds difficult in the coming days.