USD: BBDXY - Stalling Around 1200, Can It Break Through
The BBDXY range overnight was 1197.92 - 1201.02, Asia is currently trading around 1199. The BBDXY once again found decent supply capping the 1200 area. Price action is interesting though in that the price is not violently moving lower from these bouts of strength as did in the past. The price does look stretched and the market is short so a correction is not out of the question. The larger picture though still remains one of USD weakness and in the current environment rallies should continue to be met with supply, first resistance is back towards the 1205/1215 area, a sustained break above 1220 would be needed to begin challenging the shorts conviction.
- Bob Elliott on X: “Many of the dynamics that drove the dollar to secular highs are reversing. That doesn't mean a collapse is coming, but instead a likely long-term readjustment that has only just gotten started.”
- Daily Chartbook on X: "The USD-S&P correlation has turned positive ... Positive correlation could be just a temporary reflection of the post-Liberation Day market action ... However, if this trend were to persist, it could be a sign of USD losing its safe-haven characteristics. - Andrea Cicione, TS Lombard". See Graph Below.
- Lance Roberts on X: “There has been a lot of talk about the demise of the dollar, even though it still comprises 58% of foreign reserves. However, one thing that could change that is the rise of stablecoins, where 99% of all stablecoins are pegged to the dollar. If the world goes digital, as expected, the dollar may be the dominant reserve.”
There is a broad consensus that the USD is set to embark on a decent move lower as the world reduces its exposure to the US and repatriates a lot of these flows. This consensus will also result in some decent short squeezes as a lot of the market is positioned the same way.
Fig 1: USD - S&P Correlation
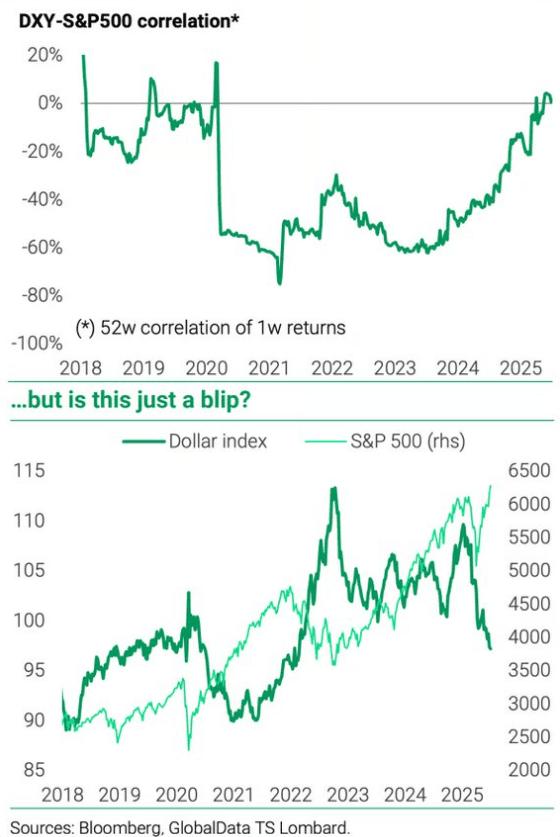
Source: MNI/@dailychartbook/TSLombard
Want to read more?
Find more articles and bullets on these widgets:
Historical bullets
US FISCAL: Available Extraordinary Measures Pick Up Ahead Of Tax Date
Treasury had $144B in "extraordinary measures" available to keep the government financed as of June 11 per a release Friday. That is up from $84B a week earlier and the highest since April 28.
- However, TGA cash continues to fall, to $309B latest (lowest since early April) Combined with a pullback in Treasury cash ($376B), keeping the total resources available to avert an "x-date" in the summer at around $450B .
- There will be another uptick in Treasury cash in the coming days, and it's likely Treasury allowed some of the extraordinary measures to be rebuilt (ie not exercised) in anticipation of more cash coming in.
- This is likely to be the last major uplift before the summer at which point x-date speculation will pick up if Congress hasn't passed a debt limit increase by then.

FED: Two Cuts Priced This Year Headed Into FOMC Week
As we head into the June Fed meeting week, market pricing is reflective of the FOMC’s messaging (that we describe in our preview):
- The next cut is only fully priced by the October FOMC meeting, with September seeing a roughly 80% implied probability of bringing the next 25bp reduction.
- Exactly 50bp of cuts are priced through end-2025, implying two Q4 cuts.
- That’s a shift from just after the May meeting, after which the next cut was fully priced by September, and there were closer to three cuts priced for the rest of the year.
- Overall cuts are seen backloaded this year (after 15bp in September, 29bp of cuts priced in Q4 - Oct/Dec combined), but falls off in Q1 (just 21bp cuts priced, 9bp of cuts priced for January and 12bp for March)

FED: Summary Of Economic Projections: Higher 2025 Inflation, Weaker Growth
The MNI Markets Team’s expectations for the updated Economic Projections are below.
- As of the May meeting, the Federal Reserve staff – whose outlook tends to be broadly shared by the median Committee member – revised their forecasts for growth weaker in 2025 and 2026, “as announced trade policies implied a larger drag on real activity relative to the policies that the staff had assumed in their previous forecast. Trade policies were also expected to lead to slower productivity growth and therefore to reduce potential GDP growth over the next few years. With the drag on demand expected to start earlier and to be larger than the supply response, the output gap was projected to widen significantly over the forecast period. The labor market was expected to weaken substantially, with the unemployment rate forecast moving above the staff's estimate of its natural rate by the end of this year and remaining above the natural rate through 2027."
- On inflation, "The staff's inflation projection was higher than the one prepared for the March meeting. Tariffs were expected to boost inflation markedly this year and to provide a smaller boost in 2026; after that, inflation was projected to decline to 2 percent by 2027."
- Our expectations for these changes fall somewhere in between those projections and the March SEP – a slightly higher unemployment rate, substantially higher inflation in 2025 but to a lesser extent in 2026, and weaker GDP growth this year. Longer-run variables should be unchanged.
MNI Markets Team Expectations For June 2025 Summary Of Economic Projections Medians
