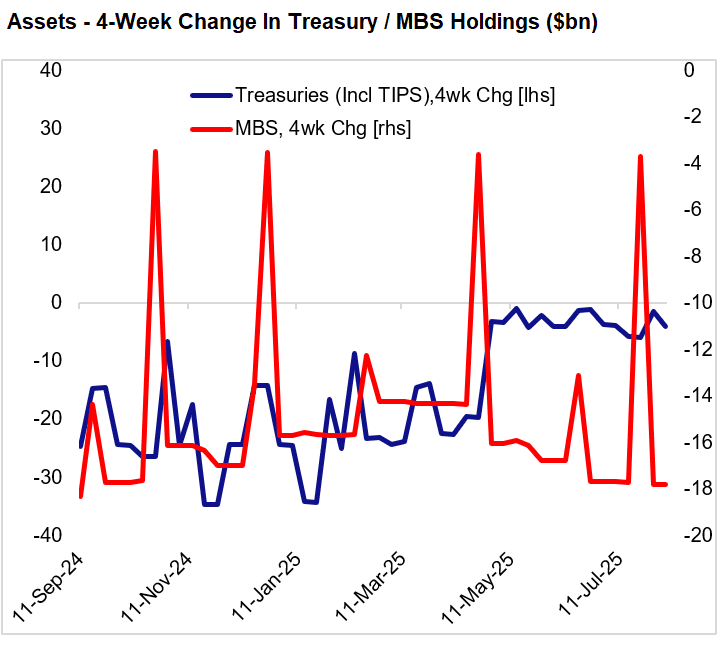
FED: Balance Sheet Runoff Continues At Steady $20B/Month Pace (2/2)
Fed asset holdings were little changed in the past week. SOMA runoff totaled $2.8B (composed of $4.2B less nominal Tsy holdings and $1.4B more TIPS), with emergency lending/liquidity facilities $0.7B lower.
- Over the last 4 weeks, the $20B/monthly expected QT pace was roughly adhered to: MBS fell $18B, with Treasury net holdings down around $2B (a fall in TIPS holdings offsetting a slight rise in nominals).
- Discount window usage accounted for the fall in lending facility usage this week; takeup is now down to $4.9B, down $1.3B in the last month and down from the 1-year high of $6.4B set in July which looks to have been a temporary blip higher.


Want to read more?
Find more articles and bullets on these widgets:
Historical bullets
US TSYS: June FOMC Minutes Signal July Hold, Forward Options Open
- Treasuries look to finish near late session highs, little new from the June FOMC minutes with members signaling a July hold while keeping futures policy options open. The June meeting minutes captured a Committee that was leaning in a slightly more hawkish direction than earlier in the year, though probably no more than should have been expected.
- The Dot Plot released at the meeting already captured most of the story: a divided Committee retains its overall easing bias but needs varying degrees of certainty before supporting a resumption of the easing cycle.
- Overall, "participants noted that the progress in returning inflation to target had continued even though that progress had been uneven" (and in a nod to the hawks and perhaps a little surprising given decent inflation readings, "a few participants noted that there had been limited progress recently in reducing core inflation.").
- Tsy Sep'25 10Y futures are currently +15.5 at 111-08.5 vs. 111-10 session high (below 111-12 high on Monday) technical resistance to watch is at 111-28, the Jul 3 high. Curves mixed with the short end flatter: 2s10s -2.616 at 47.838.
- Projected rate cut pricing has gained momentum vs morning (*) levels: Jul'25 at -1.7bp (-1.2bp), Sep'25 at -18.6bp (-17.3bp), Oct'25 at -33.7bp (-31.7bp), Dec'25 at 52bp (-49.3bp).
- Cross asset roundup: USD inching lower, Bbg index BBDXY -0.11 at 1196.53; US stocks firmer but off early session highs: SPX eminis +35.5 at 6307.5, Gold firmer (+13.19 at 3315.11), crude mildly lower (WTI -0.07 at 68.26).
USDCAD TECHS: Trend Signals Point South
- RES 4: 1.3920 High May 21
- RES 3: 1.3862 High May 29
- RES 2: 1.3798 High Jun 23
- RES 1: 1.3710/3762 High Jul 9 / 50-day EMA
- PRICE: 1.3699 @ 16:49 BST Jul 9
- SUP 1: 1.3557 Low Jul 03
- SUP 2: 1.3540 Low Jun 16 and the bear trigger
- SUP 3: 1.3503 1.618 proj of the Feb 3 - 14 - Mar 4 price swing
- SUP 4: 1.3473 Low Oct 2 2024
Short-term gains in USDCAD are considered corrective and trend signals continue to point south. Pivot resistance at the 50-day EMA, at 1.3762, remains intact. A clear break of the average would signal scope for a stronger recovery. For bears, sights are on key support at 1.3540, Jun 16 low. Clearance of this level would resume the downtrend and open 1.3503, a Fibonacci projection.
AUDUSD TECHS: Support Remains Intact
- RES 4: 0.6700 76.4% retracement of the Sep 30 ‘24 - Apr 9 bear leg
- RES 3: 0.6688 High Nov 7 ‘24
- RES 2: 0.6603 High Nov 11 ‘24
- RES 1: 0.6590 High Jul 01 and the bull trigger
- PRICE: 0.6532 @ 16:48 BST Jul 09
- SUP 1: 0.6486 Low Jul 07
- SUP 2: 0.6474/6373 50-day EMA / Low Jun 23 and a reversal trigger
- SUP 3: 0.6357 Low May 12
- SUP 4: 0.6275 Low Apr 14
The trend set-up in AUDUSD remains bullish and recent weakness is considered corrective. A fresh cycle high earlier this month maintains the bullish price sequence of higher highs and higher lows. Note too that moving average studies remain in a bull-mode position, highlighting a dominant uptrend. Scope is seen for a climb towards 0.6603 next, the Nov 11 2024 high. Initial firm support to watch is 0.6474, the 50-day EMA.