CZECHIA: Babiš Wary Of Debate In Public TV, Retail Sales Growth Slows
Sep-05 07:30
- A STEM/MARK survey for Seznam Zprávy showed that televised debates influence the opinions of around two-thirds of the voters, as all three major TV stations are hoping to organise a debate between Prime Minister Petr Fiala and opposition leader Andrej Babiš. The two leaders will face off in a debate hosted by TV Nova on October 2, the eve of the parliamentary elections, while CNN Prima News has extended invitations for September 25. However, Babiš is reportedly reluctant to attend a debate on public TV, which he repeatedly called 'pro-government' and biased against him. The Bratislava-born politician is known for doing poorly in debates, struggling to stick to one topic, and switching between Slovak and Czech when he becomes agitated, which governing Spolu coalition spin-doctors are reportedly hoping to exploit.
- Chief of the General Staff Karel Řehka warned that 'the security of the European continent is at stake' but political leaders are afraid to talk about looming geopolitical challenges and lack the sense of urgency.
- Czechia's ex-auto retail sales rose by 2.5% Y/Y in July, missing the +4.2% consensus forecast. This comes on the heels of above-forecast Q2 wage data and in-line August CPI data (albeit with a hawkish structure).
- The CNB published the schedule of its 2026 monetary policy and financial stability meetings (see here).
Want to read more?
Find more articles and bullets on these widgets:
Historical bullets
MNI: EUROZONE JUL FINAL CONSTRUCTION PMI 44.7 (45.2 JUNE)
Aug-06 07:30
- MNI: EUROZONE JUL FINAL CONSTRUCTION PMI 44.7 (45.2 JUNE)
SWEDEN: Full Forecast Updates From NIER: GDP Revised Lower
Aug-06 07:29
NIER Forecast Changes below. Diff columns represent changes relative to the June forecast round.
| 2024 | 2025 | Diff | 2026 | Diff | |
| GDP, market price | 1,0 | 0,7 | -0,3 | 2,6 | -0,1 |
| Employment | -0,5 | 0,4 | 0,0 | 0,8 | 0,0 |
| Unemployment | 8,4 | 8,7 | -0,1 | 8,4 | 0,0 |
| Hourly wage | 4,1 | 3,6 | -0,1 | 3,5 | 0,0 |
| CPI | 2,8 | 0,6 | 0,1 | 0,9 | 0,0 |
| CPIF | 1,9 | 2,5 | 0,1 | 1,6 | 0,0 |
| Policy rate | 2,75 | 1,75 | 0,00 | 1,75 | 0,00 |
| Public financial savings | -1,5 | -1,2 | -0,1 | -0,8 | -0,1 |
| Structural savings | 0,1 | 0,2 | 0,1 | -0,1 | 0,0 |
| Maastricht debt | 33,9 | 34,3 | 0,2 | 33,9 | 0,3 |
Source: NIER. Note: Percentage change and percentage points unless otherwise stated
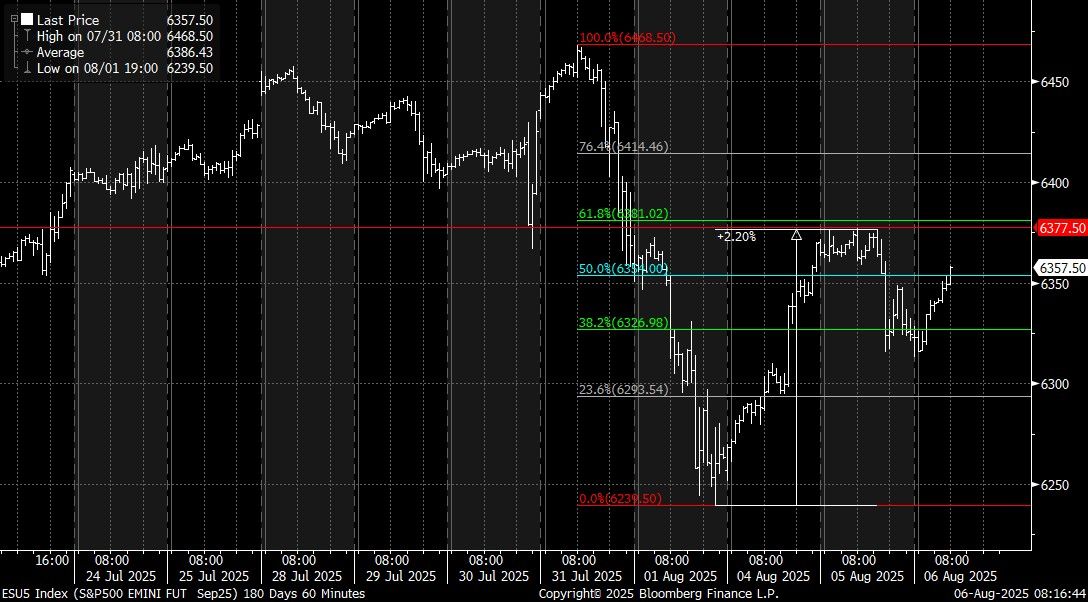
EQUITIES: Emini is back at pre ISM levels
Aug-06 07:21
- US Emini has recovered to level seen pre US ISM Yesterday afternoon, the Index was trading at that 50% retracement level of 6354.00 (see Chart).
- The Emini also found some resistance just short of the 61.8% very short term retracement of the 3.54% fall from last Thursday high.
- The 6381.02 level will be the initial resistance to watch.
(Chart source: Bloomberg Finance LP/MNI).