AUD: AUD/USD - Pares Back Early Losses As 0.6900 Finds Demand First Up
The AUD/USD has had a range today of 0.6897 - 6947 in the Asia- Pac session, it is currently trading around 0.6940, +0.15%. The AUD got hit hard early as the Asia open gapped lower following on from the rout overnight in risk, as the market settled and pared back some of its early losses the AUD drifted back to where it opened. The AUD has come under pressure as the risk-off back-drop has started to broaden with Crypto deciding Metals could not have all the fun and collapsed over 12%. US Stocks are again under pressure as Tech begins to falter, this time the broader market is not balancing out the move. The AUD has been outperforming across the board recently as leveraged funds add to their longs as further hikes are priced in, this move in risk could make these positions vulnerable in the short-term. On the day, the support back toward the 0.6850-0.6900 area proved to be solid at the first attempt. Should this first support give way the test of the pivotal 0.7100-0.7200 area will be delayed for now.
- Bloomberg - “Australia’s central bank chief said the interest-rate setting board is “monitoring closely” whether a recent surge in inflation is being driven by temporary or more persistent factors after it raised borrowing costs this week.”
- Options : Closest significant option expiries for NY cut, based on DTCC data: 0.6875(AUD913m), 0.6950(AUD864m). Upcoming Close Strikes : 0.6900(AUD1.74b Feb 9), 0.6900(AUD1.22b Feb 10), 0.7100(AUD1.09b Feb 10) - BBG
- The AUD/USD Average True Range for the last 10 Trading days: 79 Points
Fig 1: AUD/USD spot Daily Chart
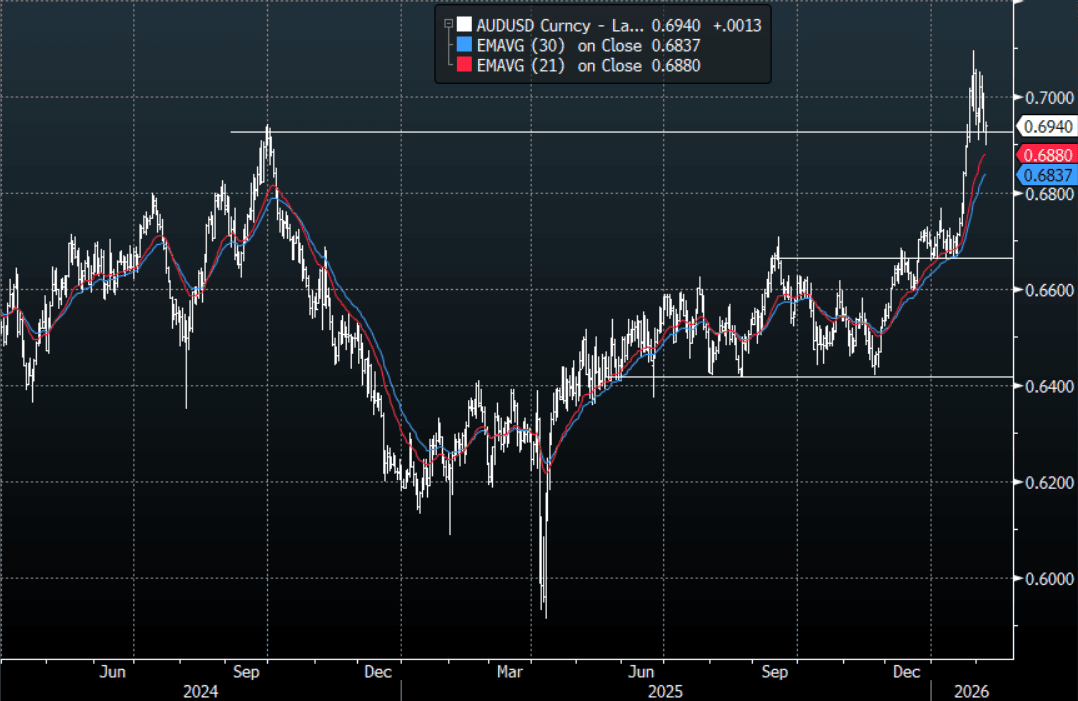
Source: MNI - Market News/Bloomberg Finance L.P
Want to read more?
Find more articles and bullets on these widgets:
Historical bullets
AUSTRALIA DATA: Multi-Dwellings Jump But House Approvals Remain Soft
The number of building approvals in November jumped 15.2% m/m after falling 6.1% m/m driven by the volatile multi-dwelling component. Private houses rose 1.3% m/m after falling 1.3% in October but were still up only 3.2% y/y. They appear to be recovering from the Q2/Q3 2025 dip. Momentum is picking up across both houses and apartments but the former is still soft.
- Strong demand and supply shortages have driven home prices higher. Approvals have struggled to improve as needed. A gradual uptrend in the total has been due to the non-house component but it remains 20% below the 2021 peak.
- Queensland and Victoria drove the jump in multi-dwelling approvals, which were their highest since June 2018 and up 55.3% y/y.
- The level of house approvals has been moving sideways since Q3 2024. The November rise was due to NSW and Queensland while they fell in SA.
Australia number of dwellings approved
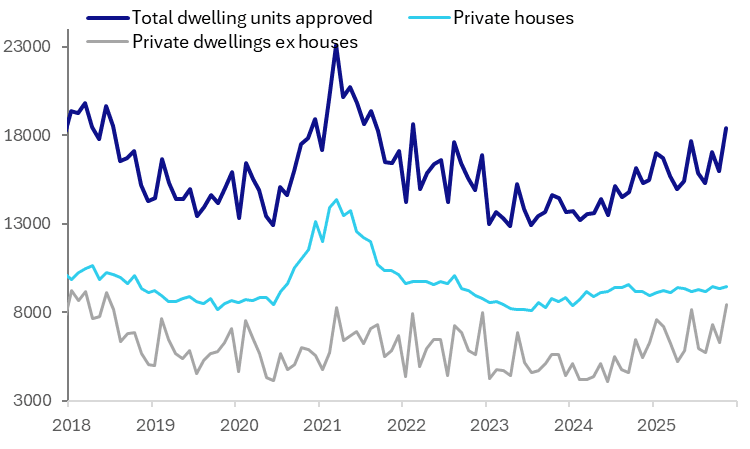
Source: MNI - Market News/ABS
STIR: RBA-Dated OIS Little Changed Versus Pre-CPI Levels
RBA-dated OIS is little changed versus pre-CPI levels. The pricing shows tightening across all meetings, with the probability of a 25bp hike rising from 38% for February to 116% by June and 184% by December 2026.
Figure 1: RBA-Dated OIS – Current
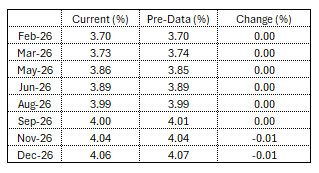
Source: Bloomberg Finance LP / MNI
CHINA PRESS: Dec Logistics Prosperity Index Hits Highest In 2025
China's logistics industry prosperity index rose by 1.5 percentage points to 52.4% in December, hitting the highest level of the year, CCTV News reported citing data by China Federation of Logistics and Purchasing. The logistics volume sub-index increased for the second month to 52.4%, along with the equipment-utilisation rate, new orders, the capital turnover rate and employment sub-indexes, which all rose into the expansion range.