MACRO ANALYSIS: Assessing The Slowdown In US Tourism Amidst Tariff Fallout
Apr-24 15:34
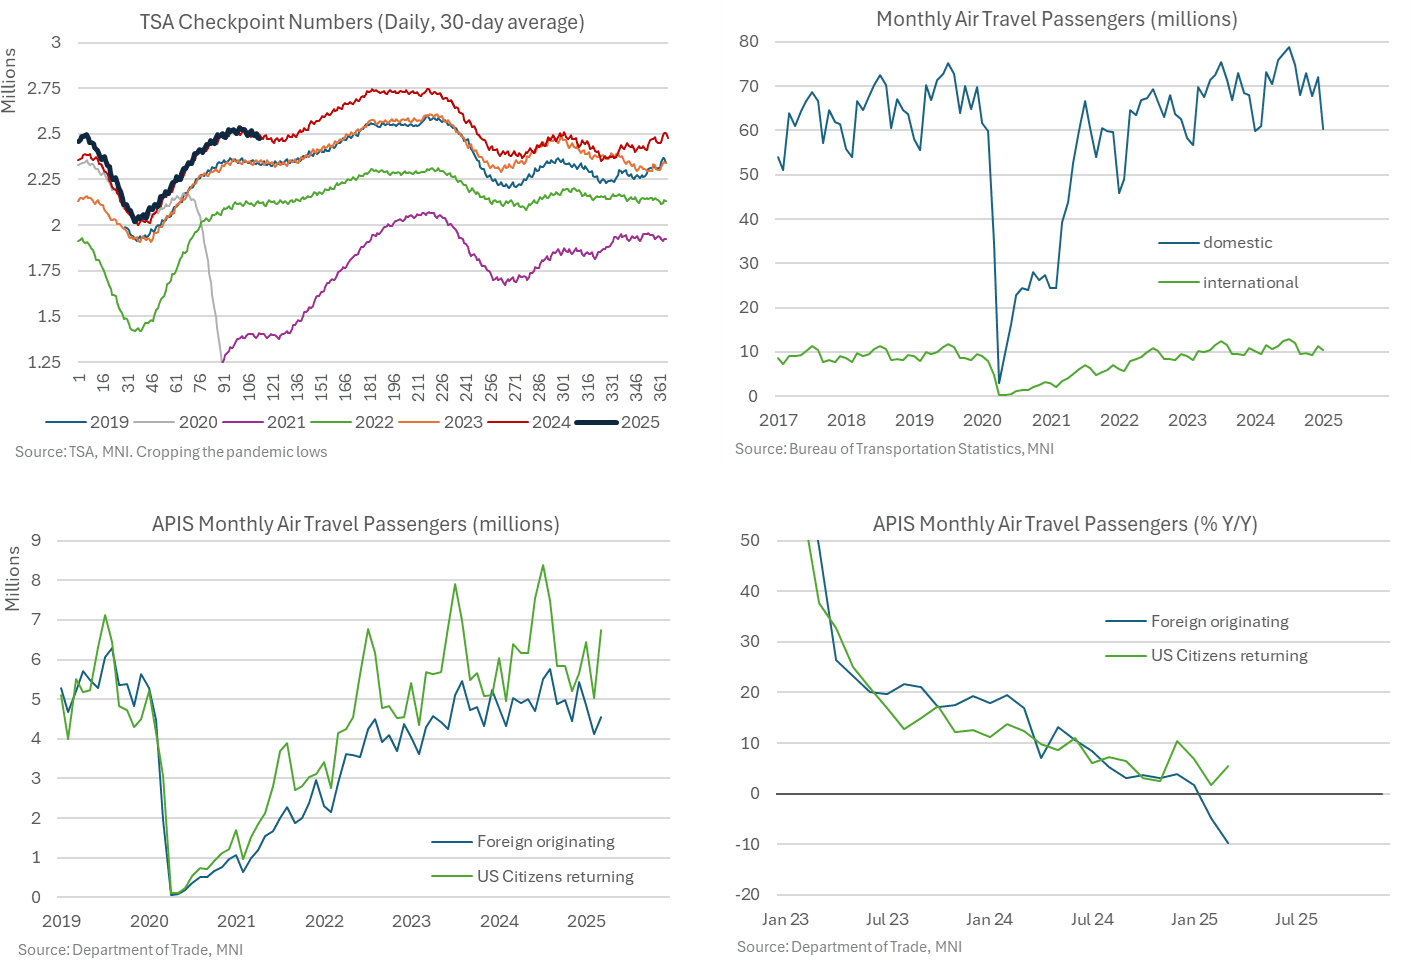
There have been anecdotal stories of travel to the US falling sharply this year since Trump’s imposition of tariffs and tighter border policies, especially when it comes to travel from neighboring Canada and Mexico. The below indicators are specifically for realized flights, with many likely booked months in advance, but do already show early weakness even if it’s being masked somewhat by modest increases in flights by US citizens.
- Daily TSA checkpoint numbers offer the most timely tracking of airport traffic although it doesn’t differentiate between domestic and international flights. That said, it’s still a useful metric which shows that passenger growth has essentially paused since President Trump’s inauguration but at least hasn’t declined, pointing to stagnating rather than outright contractionary conditions for the travel industry.
- The domestic vs international point is important as January for example saw 60 million domestic passenger vs just 10mn international passengers according to Department of Transport data.
- APIS data on the other hand strikes a sweet spot between timeliness and granularity, showing the sum of foreign passenger flying into the US and US citizens returning from overseas (which broadly match DoT international passengers) as having broadly flatlined in Y/Y terms in both February and March.
- The details however mask a sizeable decline in foreign arrivals at -9.7% Y/Y in Mar after -4.8% Y/Y in February, the first declines since the pandemic
- The latest change was mostly offset by an increase in US citizens returning (5.4% Y/Y). That said, whilst this 5% Y/Y increase in US citizens on their return leg is stronger than foreign arrivals, it’s still modestly lower than the 8.5.% Y/Y averaged in 2024 (the post-pandemic normalization of travel makes it unrealistic comparing Y/Y rates going back much further).
- With lodging away from home prices having surprised lower in the March CPI inflation report (-3.5% M/M vs expectations of 0.0 after 0.2% in Feb), further declines or ripples to other tourist-sensitive sectors could offer a partly offsetting factor against the more traditional inflationary aspects of tariffs.
Want to read more?
Find more articles and bullets on these widgets:
Historical bullets
PIPELINE: Corporate Bond Update, $2B LG Energy 4Pt Launched
Mar-25 15:30
- Date $MM Issuer (Priced *, Launch #)
- 03/25 $4.65B Bausch Health 7NC3 10%a
- 03/25 $2B #LG Energy $400M 3Y +135, $600M 5Y +145, $300M 5Y SOFR+170, $700M 10Y +170
- 03/25 $1.25B #NWB 3Y SOFR+36
- 03/25 $1.25B #NDB 3Y SOFR +65
- 03/25 $1B #MuniFin WNG 5Y SOFR+46
- 03/25 $1B *JFM 5Y SOFR+64
- 03/25 $1B #IDB 5Y SOFR+49
- 03/25 $800M Xerox $400M 5.5NC2.5, $400M 6NC3
- 03/25 $Benchmark Kingdom of Belgium 10Y SOFR+67a
MNI EXCLUSIVE: NIESR's Huw Dixon on the drive to seasonally adjust UK inflation
Mar-25 15:24
NIESR's Huw Dixon on the drive to seasonally adjust UK inflation data and its benefits to the BOE -- On MNI Policy MainWire now, for more details please contact sales@marketnews.com
GBP: Retracement Mode in EURGBP Remains in Play
Mar-25 15:20
- A retracement mode in EURGBP remains in play as attention for the cross remains on the 50-day EMA, at 0.8351. The average marks a key short-term pivot level and has been pierced. A clear break of it would undermine the recent bull theme and signal scope for a deeper pullback, towards 0.8321, a Fibonacci retracement.
- Overall, levels between 0.8300-0.8200 continue to represent the base of a longer-term range, as indicated below. Key resistance and the bull trigger are located at 0.8450, the Mar 11 high.
