JPY: Asia Wrap - USD/JPY Finds Demand Sub 148.00
The Asia-Pac USD/JPY range has been 147.70 - 148.17, Asia is currently trading around 148.05, +0.15%. USD/JPY’s gains going into the US CPI were quickly reversed after the print. Price is currently still holding above the support area between 146.00/147.00, a sustained move below this support is needed to turn the momentum potentially lower again. Until then, the recent range of 146.50-148.50 will continue to dominate. Decent demand seen below 148.00 in our session.
- JAPAN DATA July PPI In Line, Suggests Further Moderation In Headline Y/Y CPI: Japan's July PPI was close to expectations. The m/m outcome printed at +0.2%, in line with expectations, while the June outcome was revised to 0.1%m/m (originally reported as -0.2%). In y/y terms we printed at 2.6%, versus 2.5% forecast and 2.9% prior.
- JAPAN DATA Import Prices Up For First Month Since Jan, Y/Y Still Negative : For July, export and import prices both rose in m/m terms. Export prices were up 1.6%, while import prices were up 2.4%m/m. For import prices this was the first m/m rise since January of this year. In y/y terms, both export and import prices were still in negative territory, but up from the June levels. Export prices were -5.4%y/y, while imports were -10.4%.
- "JAPAN'S AKAZAWA: NOT BAD IF TRUMP EXEC ORDER COMES BY MID SEPT, US CAN'T GET INVESTMENT HELP IF PROMISES NOT KEPT. JAPAN COULD INCREASE ACTUAL US INVESTMENT PERCENTAGE, 1-2%, INVESTMENT FOLLOWS PAST CASES, COULD BE HIGHER" - BBG
- "AKAZAWA: WILL SUPPORT ISHIBA IF HE RUNS AGAIN FOR LDP HEAD" - BBG
- Options : Close significant option expiries for NY cut, based on DTCC data: 147.00($1.06b), 146.85($751m).Upcoming Close Strikes : 149.00($1.15b Aug 14) - BBG.
- CFTC data shows asset managers reduced their JPY longs +60532( Last +75119), leveraged funds slightly reduced their newly built short JPY position -29308(Last -31280).
Fig 1 : USD/JPY Spot 2H Chart
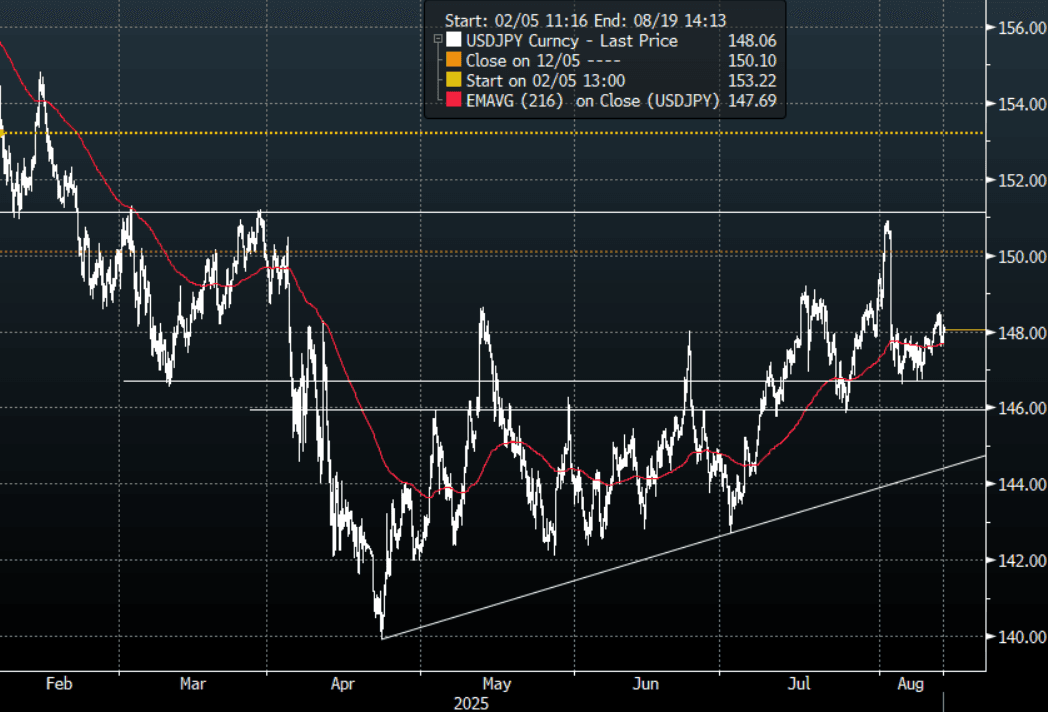
Source: MNI - Market News/Bloomberg Finance L.P
Want to read more?
Find more articles and bullets on these widgets:
Historical bullets
AUD: Asia Wrap - AUD/USD Moves Away From 0.6600 After A Soft Open For Risk
The AUD/USD has had a range of 0.6558 - 0.6588 in the Asia- Pac session, it is currently trading around 0.6565, -0.20%. CFTC Data does not show any real reduction in the AUD short positions, the price action at the end of last week suggested there might have been some paring back of these so it's interesting to see it has not had an impact yet. Risk is opened on the backfoot this morning as the world has to again digest Trump's next round of tariffs this time on Europe and Mexico. AUD/USD is being capped by decent supply towards 0.6000, price needs to clear this to gain momentum for a push higher until then it looks back to the range.
- (Bloomberg) -- “The IMF data show reserve managers shifting into USD in 4Q 2024, reducing most other currencies by modest amounts. The exceptions were large drops in the percentage of holdings for AUD and GBP. For the Aussie dollar that was the single largest change in allocations in either direction since 2012. In 1Q 2025 the shift out of AUD ramped up massively, to the lowest level on record.”
- “The US government is pressing Japan and Australia to clarify their roles in the event of a US-China war over Taiwan, a move that upsets America’s two key allies in the region, the FT reported.” -BBG
- The AUD/USD continues to hold above its support around 0.6500, looks like it's back to the 0.6500 - 0.6600 range and it should now take its cues from the USD. Watching to see if the market can build on this outperformance and break above 0.6600.
- Options : Closest significant option expiries for NY cut, based on DTCC data: none. Upcoming Close Strikes : 0.6560(AUD631m July 15), 0.6495(AUD611m July15), 0.6700(AUD611m July 16).
- CFTC Data shows Asset managers added to their shorts slightly -38252, the Leveraged community pared back their shorts to -19061.
AUD/JPY - Today's range 96.46 - 96.93, it is trading currently around 96.75, -0.20%. The pair has had a good move above 96.00 and this time looks to be building real momentum to extend higher. The market has been caught wrong-footed in both legs of this pair and price action suggests a potential move back to 99.00/100.00. Dips back to 95.50/96.00 should now be supported.
Fig 1: AUD CFTC Data
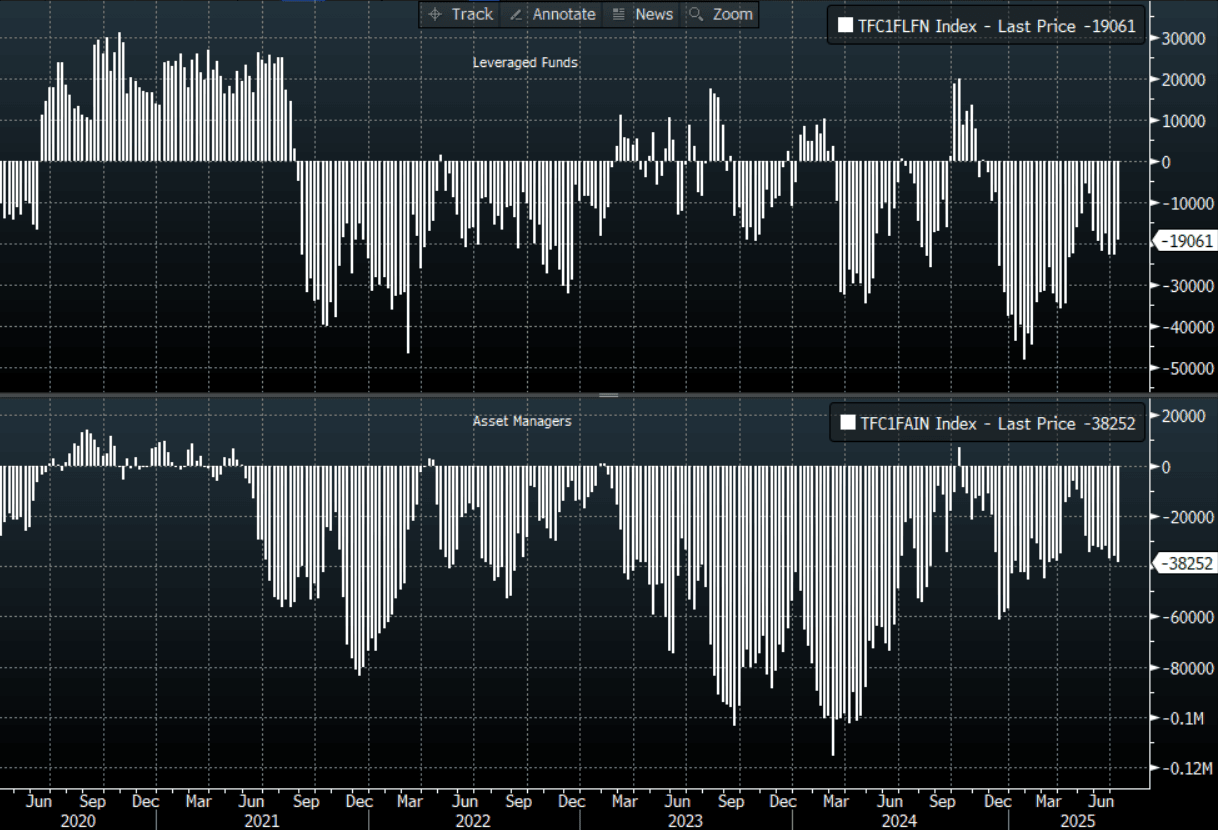
Source: MNI - Market News/Bloomberg Finance L.P
AUSSIE BONDS: AU-US 10Y Diff Is Near Middle Of Range
The AU-US 10-year cash yield differential currently stands at -6bps, positioned near the middle of the +/- 30bps range that has held since November 2022.
- A simple regression of the 10-year yield differential against the AU-US 1-year forward 3-month swap rate (1Y3M) differential over the past year suggests the current spread is slightly below fair value at -4bps.
- The 1Y3M differential, a key gauge of expected relative policy trajectories over the next 12 months, has traded within a 40bp range this year and is currently in the top half of the range at ~-5bps after last week’s surprise decision by the RBA to leave the cash rate unchanged at 3.85%.
- In early February, the 1Y3M differential had declined approximately 100bps since mid-September 2024, falling from +60bps to -40bps.
Figure 1: AU-US Cash 10-Year Yield Differential (%)
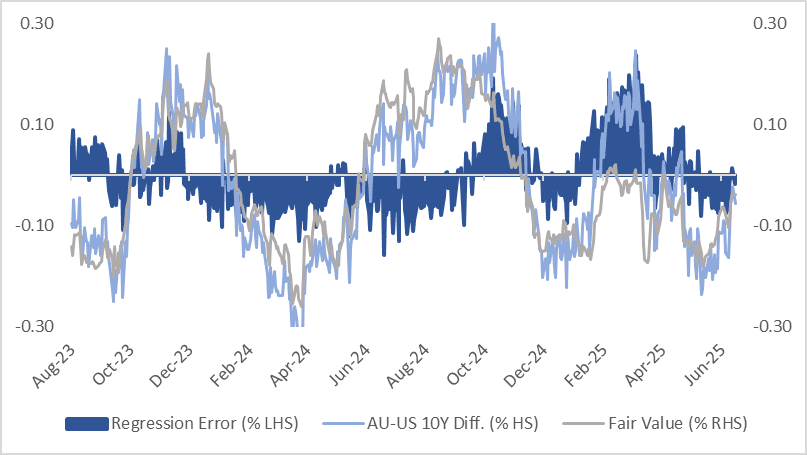
Source: Bloomberg Finance LP / MNI
ASIA STOCKS: Equity Flows Ended Last Week Positively, Taiwan The Standout
Asia Pac equity inflow momentum was mostly positive into the end of last week. South Korea and Taiwan remained the standouts, see the table below.
- Taiwan has seen just over $1bn in net inflows over the past 5 trading sessions. South Korea trailed slightly, at just above $700mn. The early impetus for South Korean markets today is modest outflow pressures, as US equity futures track weaker in response to Trump's 30% tariff threat against the EU and Mexico (made over the weekend).
- Markets remain hopeful that lower tariff rates can be negotiated ahead of the Aug 1 deadline. Earnings, particularly in the tech space will be the other focus point.
- Elsewhere inflow momentum was positive into Indian markets, as YTD outflows continue to be scaled back.
- A positive end to the week for Thailand was also evident.
Table 1: Asian Markets Net Equity Flows
| Yesterday | Past 5 Trading Days | 2025 To Date | |
| South Korea (USDmn) | 274 | 711 | -8578 |
| Taiwan (USDmn) | 615 | 1073 | -1915 |
| India (USDmn)* | 98 | 614 | -7805 |
| Indonesia (USDmn) | 28 | -115 | -3502 |
| Thailand (USDmn) | 68 | 90 | -2366 |
| Malaysia (USDmn) | -24 | -122 | -2793 |
| Philippines (USDmn) | 1 | -14 | -562 |
| Total (USDmn) | 1060 | 2237 | -27520 |
| * Data Up To July 10 |
Source: Bloomberg Finance L.P./MNI