JPY: Asia Wrap - USD/JPY Finds A Base, Probes Above 147.00 On Trade Deal
The Asia-Pac USD/JPY range has been 146.20 - 147.20, Asia is currently trading around 147.00, +0.25%. USD/JPY continues to frustrate the market and has given back a large portion of its recent gains, around 250 points in 2 days. The move lower in US yields is providing serious headwinds for the pair and the USD seems to be floundering in all scenarios. We are probing the first support around 146.50 this morning where some demand should be seen first up as the market digests the trade deal with the US, next level is the pivotal 144.00/145.00 area.
- Kelly Eckhold(Westpac) on LinkedIn: “Trump trade deals progressing. Japan interestingly opens up the rice market in exchange for their tariff being reduced to 15%. That’s a huge change for Japan where rice imports have not been allowed.”
- "ISHIBA: DEAL WON'T SACRIFICE JAPAN AGRICULTURE AT ALL, WILL INCREASE US RICE IMPORTS WITHIN EXISTING BRACKET" - BBG
- MNI: BOJ's Uchida - Gradual Rate Hike, But No Pace Signalling. TOKYO - Bank of Japan Deputy Governor Uchida stated on Wednesday that the central bank will maintain its approach of gradually raising the policy interest rate, citing persistently low real interest rates. However, he offered no guidance on the timing or pace of future rate hikes, citing elevated levels of uncertainty.
- JAPAN Local Media States PM Ishiba To Resign In August : Headlines have crossed from local newspaper Mainichi that PM Ishiba will resign by the end of August. Via Rtrs: "Japan's Prime Minister Shigeru Ishiba has made up his mind to resign, Mainichi newspaper reported on Wednesday." A later headline from the Yomiuri newspaper reported he may announce resignation as soon as this month.
- "JAPAN 40-YEAR BOND BID-COVER RATIO 2.13 VS 12-MONTH AVG 2.48, SALE DRAWS WEAKEST DEMAND RATIO SINCE 2011, BOND FUTURES HOLD LOSS AFTER 40-YEAR DEBT AUCTION" - BBG
- Options : Close significant option expiries for NY cut, based on DTCC data: 146.00($734m), 148.00($902m).Upcoming Close Strikes : 147.50($1.5b July 24), 145.00($1.15bm July 25) - BBG.
- CFTC data shows Asset managers starting to reduce JPY longs more aggressively +71610, while leveraged funds have started to build into a new short JPY position -12606.
Fig 1 : USD/JPY Spot 120min Chart
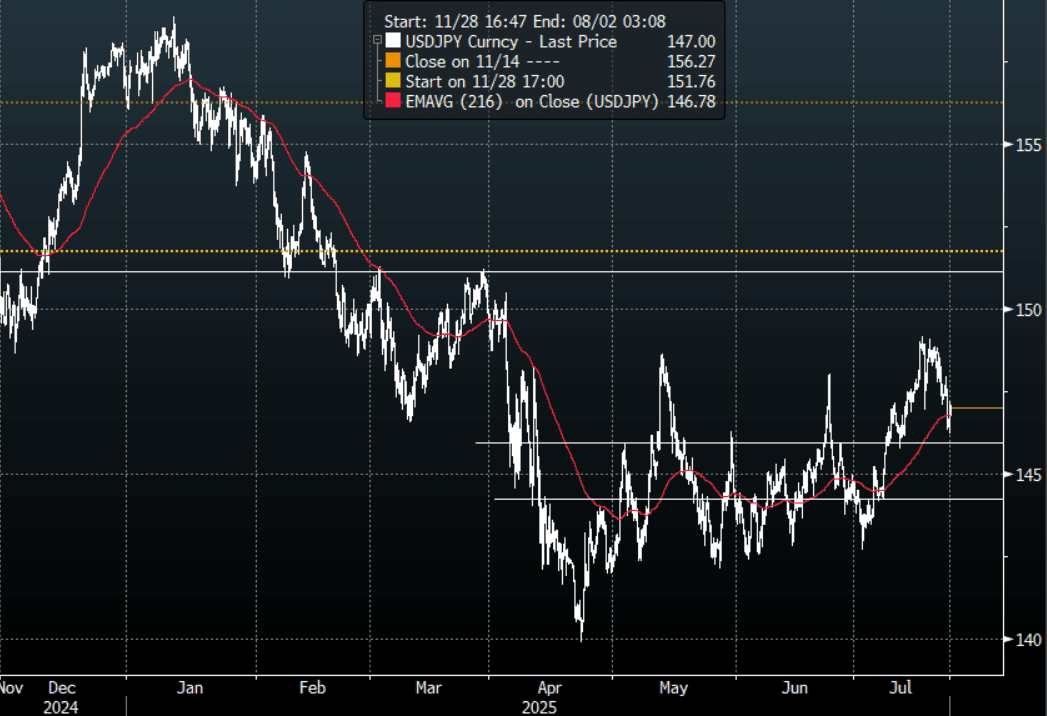
Source: MNI - Market News/Bloomberg Finance L.P
Want to read more?
Find more articles and bullets on these widgets:
Historical bullets
NZD: Asia Wrap - NZD/USD Fails Above 0.6000 As The USD Bounce Builds Momentum
The NZD/USD had a range of 0.5918 - 0.5966 in the Asia-Pac session, going into the London open trading around 0.5925,-0.70%. The NZD has remained under pressure after gapping lower on the Asian open. The market is digesting the implications of a longer and more sustained US involvement in the conflict and how Iran might react to this, potentially blocking the Strait of Hormuz.
- (Bloomberg) - “New Zealand’s dollar is particularly vulnerable in the event of a haven rally in the US currency should the conflict between Iran and Israel pose constraints on oil supply, according to Bank of America Corp.”
- “Among Group-of-10 commodity currencies, the Kiwi “is the only energy importer and most vulnerable if Middle East oil supply is impacted more severely,” wrote Bank of America.”
- The NZD could not get back above 0.6000 on Friday and this morning has seen another wave of selling as the market digests the weekend's news and the implications of what further US involvement might imply.
- Technically while the support around 0.5850 holds in NZD/USD it is still in an uptrend but should risk start to come under more significant pressure the market is likely to test this.
- Options : Closest significant option expiries for NY cut, based on DTCC data: 0.5830(NZD300m June 23). Upcoming Close Strikes : 0.5690(NZD621m June 25)
- CFTC Data showed Asset managers paring back their shorts slightly once more over the week, the leverage community did likewise.
- AUD/NZD range for the session has been 1.0797 - 1.0828, currently trading 1.0810. The cross is struggling to get any momentum back above 1.0800 for now, it needs to hold above here and start extending higher to put a higher low in place. The longer it fails to extend higher the more likely it begins to drift lower again, a break sub 1.0750 will see downward momentum return.
Fig 1: NZD/USD Spot Daily Chart
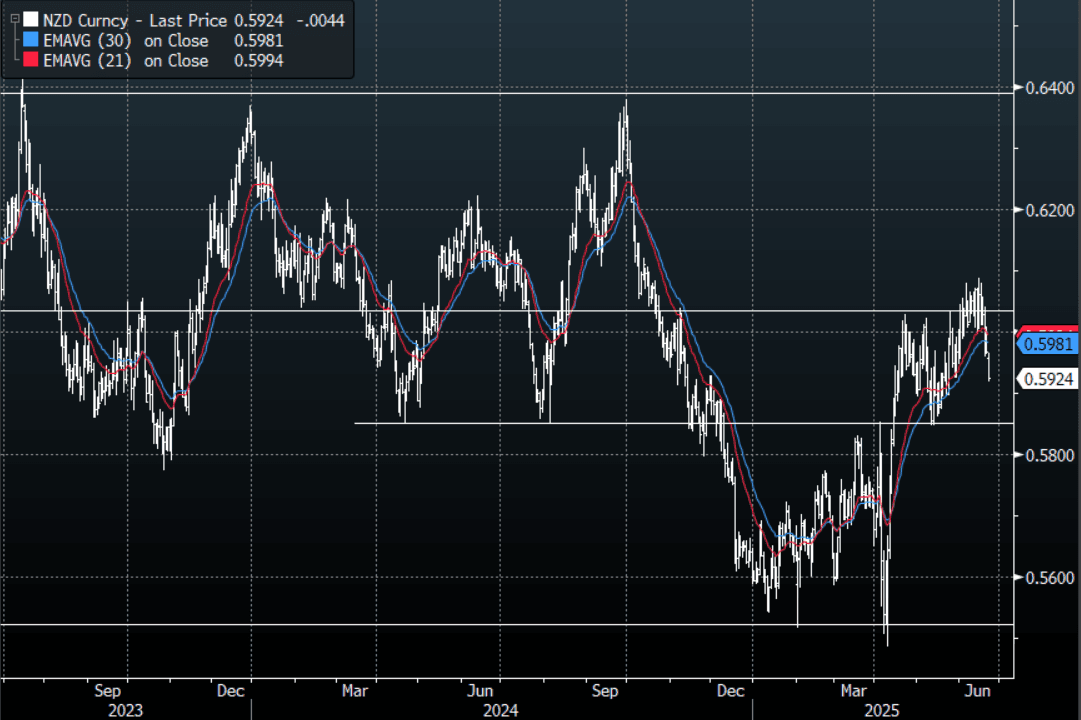
Source: MNI - Market News/Bloomberg Finance L.P
JPY: Asia Wrap - USD/JPY Eyes Oil And Is Challenging A Market Long JPY
The Asia-Pac USD/JPY range has been 146.15 - 146.91, Asia is currently trading around 146.90, +0.55%. USD/JPY has broken through the 146.50 area this morning in reaction to the US bombing and the implications of potential extended US involvement in the conflict. The Market is caught long JPY and the implications of even higher oil prices as Iran contemplates blocking the Strait of Hormuz is challenging their conviction.
- “Pimco has been buying long-term JGBs to take advantage of a “dislocation” in the market, Andrew Balls told the FT, adding there’s a strong case for authorities to “issue more in the parts of the curve where the demand is.”(BBG)
- "HAYASHI: NOT TRUE US DEMANDED 3.5% GDP ON DEFENSE SPENDING" - BBG
- USD/JPY price action continues to point to a market that is positioned long JPY.
- "Asian currencies are likely to see further downside in the near-term, amid rising vulnerability to oil prices"(BBG).
- USD/JPY price action continues to point to a market that is positioned long JPY.
- Having broken above 146.50 this morning the market will be closely watching the oil price for short-term clues.
- The market is positioned for a move lower in USD/JPY and with this positioning at extremes we have seen the risk of pullbacks increase. A sustained break above 146.50/147.00 would begin to challenge the conviction of these shorts and focus will return to the 150.00/151.00 area.
- Options : Close significant option expiries for NY cut, based on DTCC data: 145.50($323m).Upcoming Close Strikes : 144.50($1.34b June 25)
- CFTC data shows Asset managers maintained their already extensive JPY longs, while leveraged funds have pared back their own longs that had just begun to be rebuilt.
Fig 1 : USD/JPY Spot Daily Chart
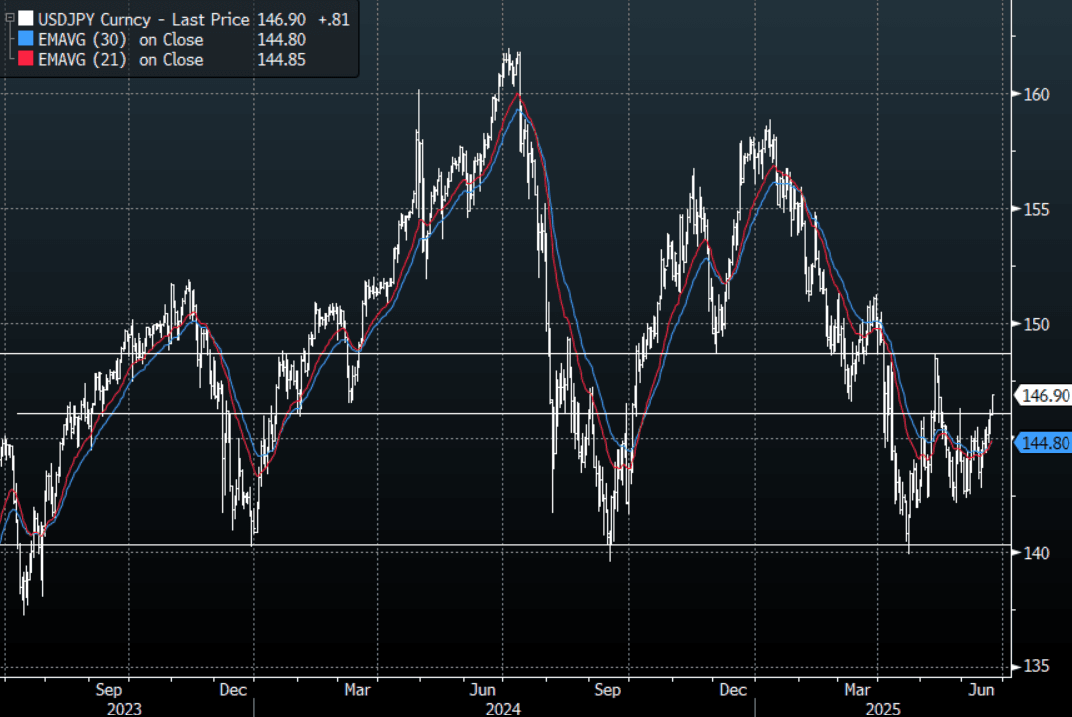
Source: MNI - Market News/Bloomberg Finance L.P
AUD: Asia Wrap - Breaks Below 0.6450, Looking Towards 0.6350 Support
The AUD/USD has had a range of 0.6398 - 0.6449 in the Asia- Pac session, it is currently trading around 0.6405. The AUD has remained under pressure after gapping lower on the Asian open, -0.70%. The market is digesting the implications of a longer and more sustained US involvement in the conflict and how Iran might react to this, potentially blocking the Strait of Hormuz.
- AUSTRALIA DATA: Pickup In June Activity But Manufacturing Environment Difficult. The preliminary June S&P Global PMIs showed that services activity in Australia ended Q2 on a more positive note with the index up to 51.3 from 50.6. Manufacturing was stable at 51.0 as the global market becomes more challenging, which left the composite up to 51.2 from 50.5, the highest since March. The Q2 average composite PMI was 50.9 down slightly from Q1’s 51.1, signalling that growth was little changed and remained positive but lacklustre.
- "FITCH RATINGS: AUSTRALIAN MORTGAGE ARREARS SHOW SHARPER THAN EXPECTED RISE, AUSTRALIA MORTGAGE ARREARS RISE IN 1Q.”(BBG)
- The AUD/USD looks likely to have a look back towards its 0.6350/0.6400 support.
- Price remains in the wider 0.6350 - 0.6550 range for now. After failing to break higher, the focus will now turn to whether the support can hold, a close back below 0.6350 is needed to challenge the newly formed uptrend.
- Options : Closest significant option expiries for NY cut, based on DTCC data: 0.6510(AUD397m). Upcoming Close Strikes : 0.6500(AUD1.21b June 26), 0.6450(AUD553m June 26).
- CFTC Data shows Asset managers maintaining their shorts, the Leveraged community though have again added to their shorts.
- AUD/JPY - Today's range 93.85 - 94.38, it is trading currently around 94.00. Choppy price action as the pair establishes a range between 92.00 - 96.00. A break back below 91.50/92.00 is needed to see the move lower regain momentum and the focus turn back to the year's lows again. The move higher in oil and a market already very long JPY is preventing this pair moving lower in reaction to a souring risk backdrop for now.
Fig 1: AUD/USD spot Daily Chart
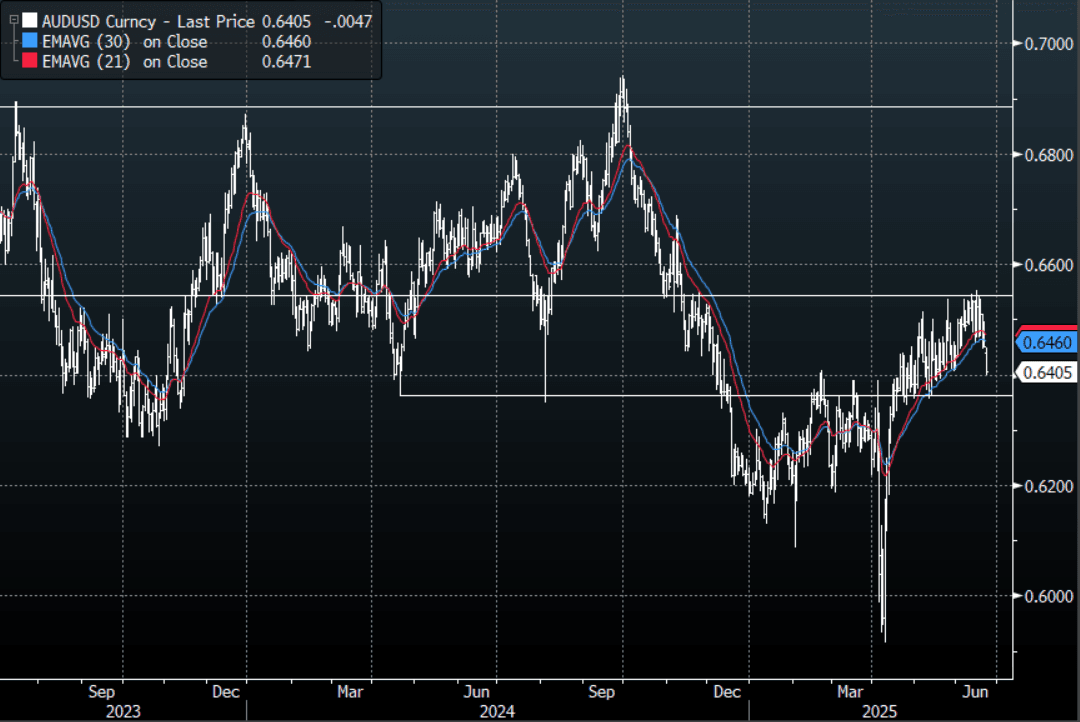
Source: MNI - Market News/Bloomberg Finance L.P