NZD: Asia Wrap - NZD/USD Consolidates Just Above 0.5900
The NZD/USD had a range of 0.5903 - 0.5923 in the Asia-Pac session, going into the London open trading around 0.5920, +0.03%. US Yields collapsed in response to the NFP data which sparked a kneejerk response lower in the USD. This was also a very bad day for US stocks which finally look to be pulling back from elevated levels. The question for the NZD going forward is does the USD see sellers quickly return in response to the move in rates, or can the USD rise from the ashes and return as a safe haven. NZD/USD bounced nicely off its 0.5850 support but would suspect sellers would return on any bounce back toward 0.6000 initially as the market decides how best to trade the USD.
- “AUCKLAND JULY AVERAGE HOUSE PRICE FALLS 2.4% Y/Y: BARFOOT" - BBG
- NEW ZEALAND: Labour Market Data Likely Deteriorated In Q2. The focus of the week will be the Q2 labour market data published on Wednesday. It is expected to show that it weakened in the quarter after some signs of stabilisation in Q1. The unemployment rate is forecast to rise 0.2pp to 5.3% more than the RBNZ’s 5.2% May projection. If the data print is as weak as or weaker than the Bloomberg consensus, then a rate cut on August 20 is likely.
- Options : Closest significant option expiries for NY cut, based on DTCC data: none. Upcoming Close Strikes : 0.5970(NZD3496m Aug 7). - BBG
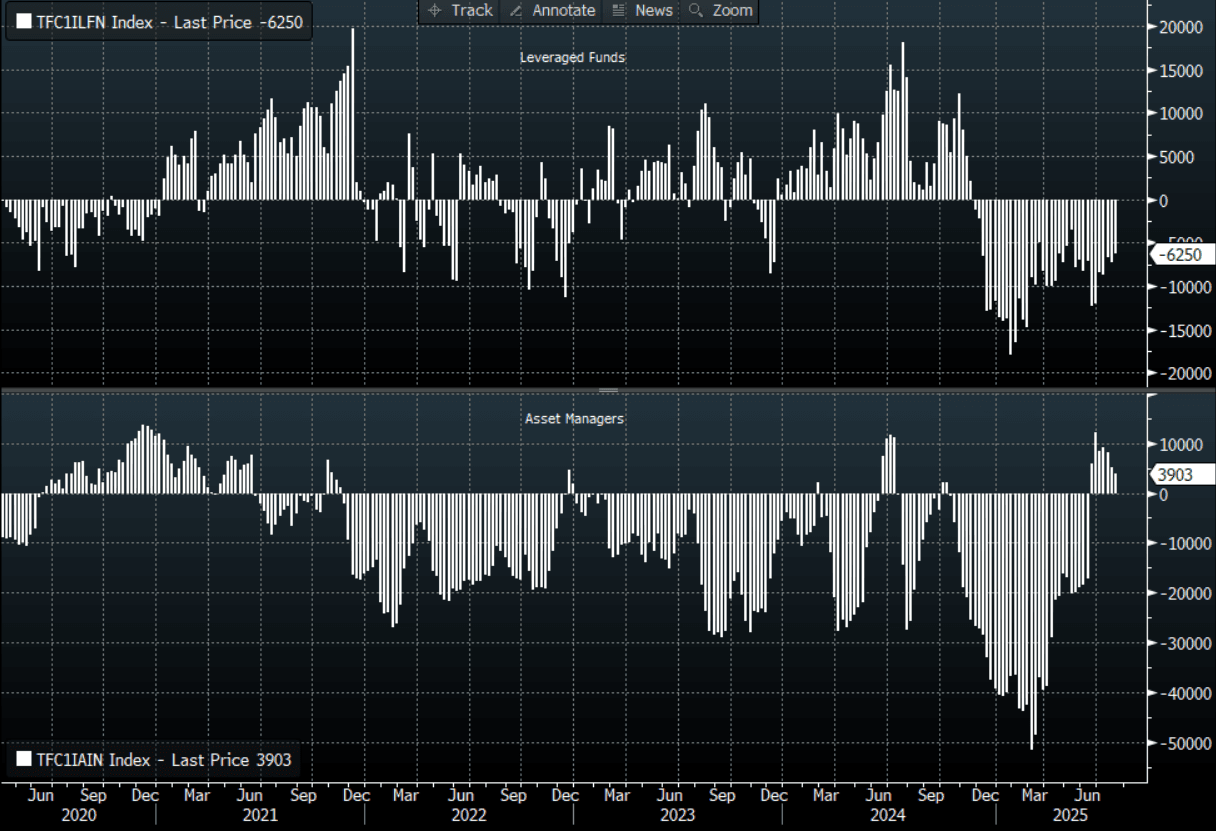
- CFTC Data shows Asset Managers again reduced their newly built longs in NZD +3903(Last +5034), the Leveraged community reduced their shorts slightly -6250(Last -7328).
- AUD/NZD range for the session has been 1.0930 - 1.0959, currently trading 1.0950. The Cross continues to consolidate on a 1.09 handle as the pair tries to build some momentum to move higher.
Fig 1: NZD CFTC Data
Source: MNI - Market News/Bloomberg Finance L.P
Want to read more?
Find more articles and bullets on these widgets:
Historical bullets
USDCAD TECHS: Trend Outlook Remains Bearish
- RES 4: 1.4111 High Apr 4
- RES 3: 1.4016 High May 12 and 13 and a key resistance
- RES 2: 1.3920 High May 21
- RES 1: 1.3674/3776 20- and 50-day EMA values
- PRICE: 1.3607 @ 16:12 BST Jul 4
- SUP 1: 1.3557 Low Jul 03
- SUP 2: 1.3540 Low Jun 16 and the bear trigger
- SUP 3: 1.3503 1.618 proj of the Feb 3 - 14 - Mar 4 price swing
- SUP 4: 1.3473 Low Oct 2 2024
The trend needle in USDCAD points south and this week’s move down reinforces current conditions. S/T gains between Jun 16 - 23 appear to have been corrective. Key support and the bear trigger is 1.3540, Jun 16 low. Clearance of this level would resume the downtrend and open 1.3503, a Fibonacci projection. Pivot resistance is at the 50-day EMA, at 1.3776. A clear break of this average would signal scope for a stronger recovery.
AUDUSD TECHS: Bull Cycle Remains In Play
- RES 4: 0.6700 76.4% retracement of the Sep 30 ‘24 - Apr 9 bear leg
- RES 3: 0.6688 High Nov 7 ‘24
- RES 2: 0.6603 High Nov 11 ‘24
- RES 1: 0.6590 High Jul 01
- PRICE: 0.6548 @ 16:05 BST Jul 04
- SUP 1: 0.6521 20-day EMA
- SUP 2: 0.6468/6373 50-day EMA / Low Jun 23 and a reversal trigger
- SUP 3: 0.6357 Low May 12
- SUP 4: 0.6275 Low Apr 14
The trend set-up in AUDUSD remains bullish and the pair is holding on to its recent gains. The latest break higher maintains the bullish price sequence of higher highs and higher lows, the definition of an uptrend. Moving average studies are in a bull-mode position, highlighting a dominant uptrend. Sights are on 0.6603 next, the Nov 11 2024 high. Key short-term support has been defined at 0.6373, the Jun 23 low.
EURJPY TECHS: Northbound
- RES 4: 171.88 High Jul 19 ‘24
- RES 3: 171.28 1.382 proj of the Feb 28 - Mar 18 - Apr 7 price swing
- RES 2: 171.09 High Jul 23 ‘24
- RES 1: 170.61 High Jul 03
- PRICE: 170.22 @ 16:04 BST Jul 04
- SUP 1: 169.04 Low Jul 02
- SUP 2: 167.87 20-day EMA
- SUP 3: 167.13 Low Jun 20
- SUP 4: 165.66 50-day EMA
EURJPY traded higher on Thursday resulting in a print above 170.47, the 76.4% retracement of the Jul 11 - Aug 5 sell-off. A clear break of this price point would strengthen bullish conditions and signal scope for extension. This would open 170.28 next, a Fibonacci projection. The trend is overbought, a pullback would unwind this condition. Support to watch lies at 167.87, the 20-day EMA.