AUD: Asia Wrap - AUD/USD Retraces A Little Going Into NFP
The AUD/USD has had a range of 0.6422 - 0.6440 in the Asia- Pac session, it is currently trading around 0.6435, +0.17%. The momentum higher in risk could not be maintained overnight and a higher than expected PCE print overnight brought the hawkish tone of the Fed back into view. This saw the early AUD/USD rally stall and quickly move lower again. That looks like a very poor Daily close for US Stocks and could signal its time for risk to take a breather which opens the possibility of some reversion back to the mean. Should this unfold it will add to the AUD/USD headwinds being faced by a resurgent USD. The 0.6350 area is very important and a sustained move below that level should get the bears excited again as momentum would turn lower. The market will now be gearing up for the NFP print tonight which could add further momentum to the move or help put a base in.
- "AUSTRALIA 2Q PRODUCER PRICES RISE 0.7% Q/Q (prior 0.9%), AUSTRALIA 2Q PRODUCER PRICES RISE 3.4% Y/Y(prior 3.7%) " - BBG
- (Bloomberg) -- Australian home prices climbed for a sixth straight month with every major city reporting gains, while signs of resurgent rents are set to stretch the budgets of households in this segment.
- Options : Closest significant option expiries for NY cut, based on DTCC data: 0.6650(AUD374m). Upcoming Close Strikes : 0.6000(AUD1.31b Aug 5), 0.6600(AUD847m Aug 5) - BBG
- AUD/JPY - Asia-Pac range 96.79 - 97.06, Asia is trading around 96.95. The pair has bounced nicely off its support around 96.00 and is again testing the recent tops above 97.00 this morning. The support between 95.00 - 96.00 held very well last week and the pair is looking to regain its momentum for a move higher. With risk having a huge reversal lower overnight and opening soft this morning you would be forgiven for thinking this pair should be finding some headwinds and potentially drift lower. JPY longs are being squeezed and this is overriding everything.
Fig 1: AUD/USD spot Weekly Chart
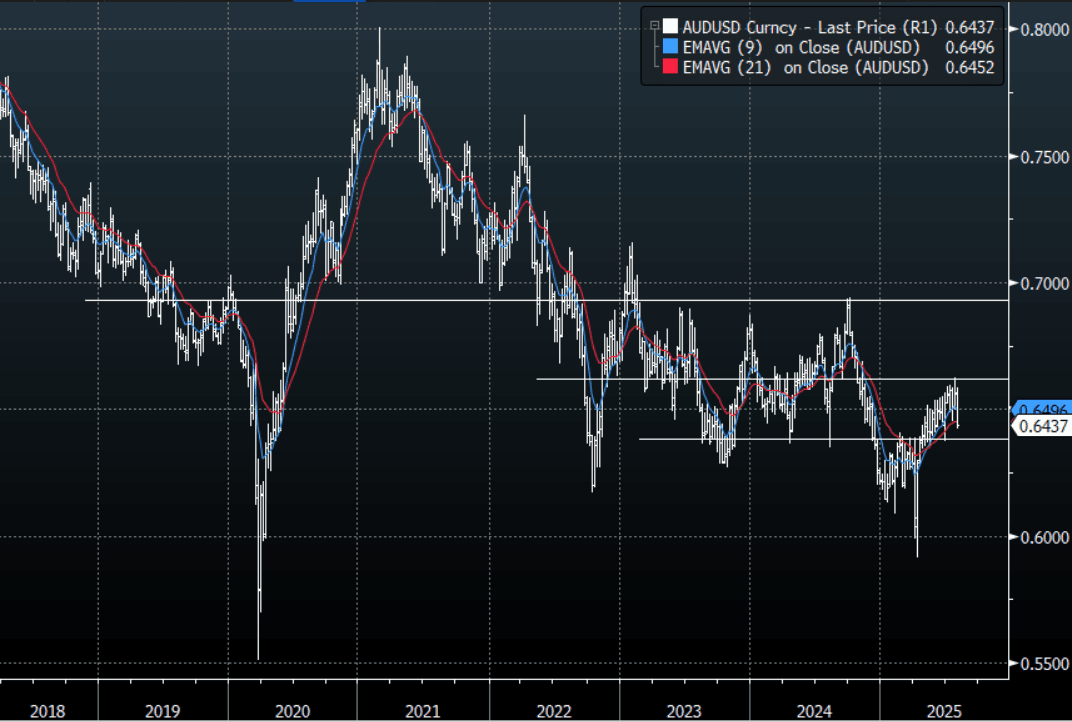
Source: MNI - Market News/Bloomberg Finance L.P
Want to read more?
Find more articles and bullets on these widgets:
Historical bullets
AUD: Asia Wrap - Disappointing Retail Data Finds Bids Around 0.6560
The AUD/USD has had a range of 0.6565 - 0.6583 in the Asia- Pac session, it is currently trading around 0.6583. The pair tested lower on the back of a lower than expected retail sale sprint, bids emerged back around 0.6560 and the pair has erased all of its losses going into London. US Equity futures have drifted higher in Asia, ESU5 +0.30%, NQU5 +0.35%. The market will be watching for signs of this move building upward momentum for a more significant move higher, could the catalyst be NFP on Thursday ?
- Australian retail sales rose a modest 0.2%m/m in May, after a revised flat outcome in April (originally reported as a -0.1% dip). The market consensus for the May outcome was a +0.5% rise. Other data showed May building approvals up 3.2%m/m, which was slightly below the 4.0% forecast. The April fall was revised to -4.1%m/m.
- (Bloomberg) -- Weak retail sales confirm our concerns about Australia’s consumers, who are keeping their wallets shut despite the Reserve Bank starting rate cuts in February and May. So far, there’s little sign the moves are reviving spending, and a stronger rebound likely hinges on additional easing.
- The AUD/USD is breaking through the top of its recent range as the pressure on the USD increases. First support is seen back towards 0.6500.
- The AUD needs a sustained break above 0.6550/0.6600 to potentially start building momentum for an extended move higher, a close back above 0.6600 and the focus would turn back to 0.6900/0.7000.
- Options : Closest significant option expiries for NY cut, based on DTCC data: 0.6550(AUD654m). Upcoming Close Strikes : 0.6600(AUD2.55bm July4).
- AUD/JPY - Today's range 94.30 - 94.53, it is trading currently around 94.50, +0.1%. Choppy price action as the pair establishes a range between 92.00 - 96.00. Momentum higher seems to be stalling, a break sub 0.9350 would be needed to see the focus turn lower once more.
Fig 1: AUD/USD spot Daily Chart
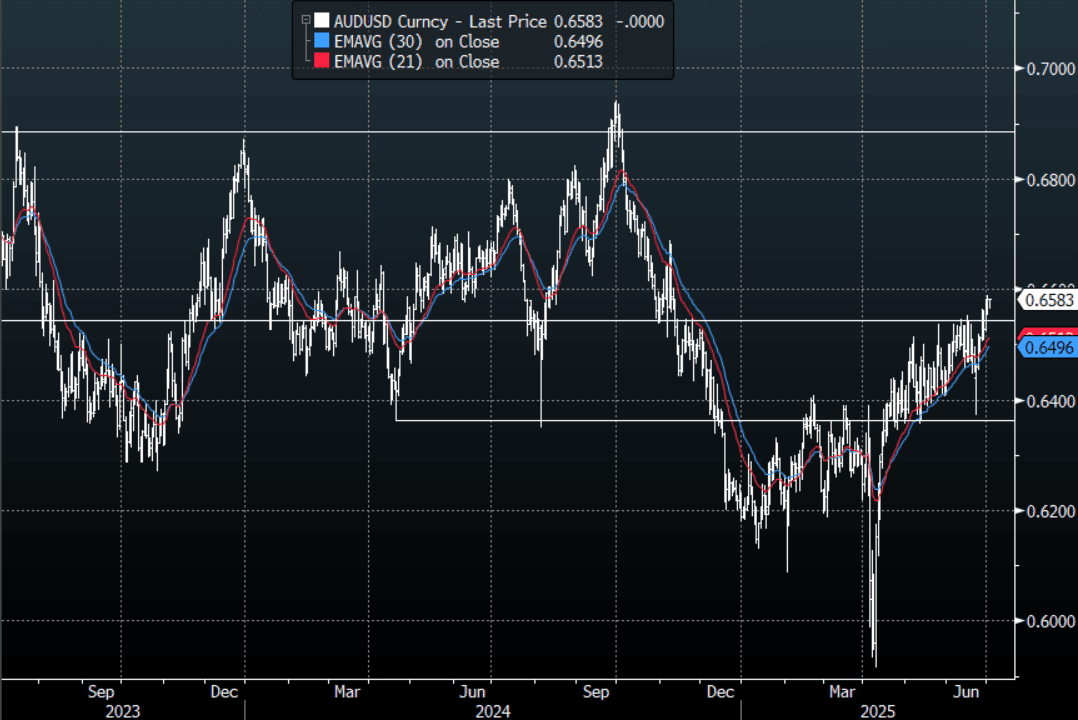
Source: MNI - Market News/Bloomberg Finance L.P
US TSYS: Asia Wrap - Yields Drift Higher
The TYU5 range has been 111-27 to 111-30+ during the Asia-Pacific session. It last changed hands at 111-27, down 0-00+ from the previous close.
- The US 2-year yield has drifted higher trading around 3.776%.
- The US 10-year yield has edged higher trading around 4.25%, up 0.01 from its close.
- The 10-year yield has seen a bounce after a very strong move lower with some paring back of longs ahead of NFP. Any bounce back to the 4.35% area would offer buyers a decent level to add again.
- (Bloomberg) - “Jerome Powell repeated that the Fed probably would have cut rates further this year absent Trump’s expanded use of tariffs, although he didn’t rule out easing at July’s meeting.”
- “The $3.3 trillion US tax and spending bill passed the Senate after JD Vance cast the tie-breaking vote. The House is expected to vote on the package Wednesday, but passage isn’t guaranteed.”(BBG)
- Data/Events: MBA Mortgage Applications, ADP, Challenger Job Cuts
Fig 1: 10-Year US Yield Daily Chart
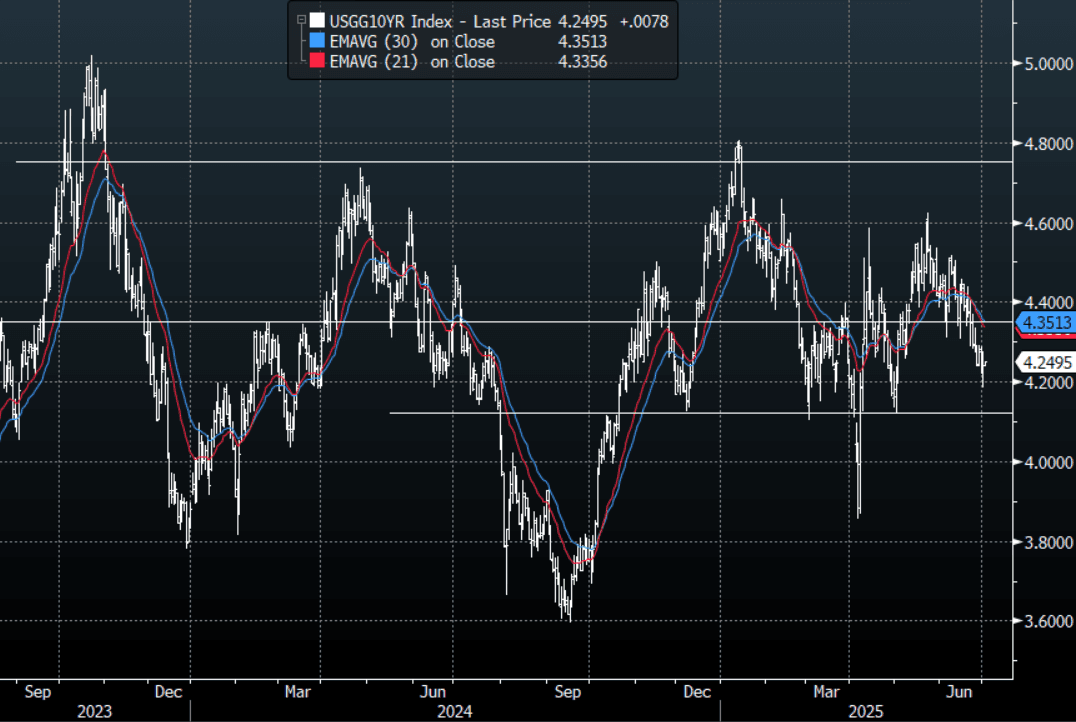
Source: MNI - Market News/Bloomberg Finance L.P
BONDS: NZ-US 10Y Differential In the Top Half Of This Year’s Range
NZGBs are richer today, with benchmark yields 2bps lower. The NZGB 10-year has slightly outperformed US 10-year since yesterday’s close, with the NZ-US yield differentials 2bps tighter on the day.
- At +25bps, the NZ-US 10-year differential is in the top half of the -20bp to +40bps range seen this year.
- A simple regression analysis of the 3-month forward swap rate spread (1Y3M) over the past 18 months indicates the 10-year yield differential is around 7bps below its estimated fair value of +32bps.
- Notably, the regression error has fluctuated within a range of ±15bps over the past year, highlighting some variability in the relationship.
- The 1Y3M differential continues to be a key driver of market expectations for long-term yield convergence.
Figure 1: NZ-US 10-Year Yield Differential
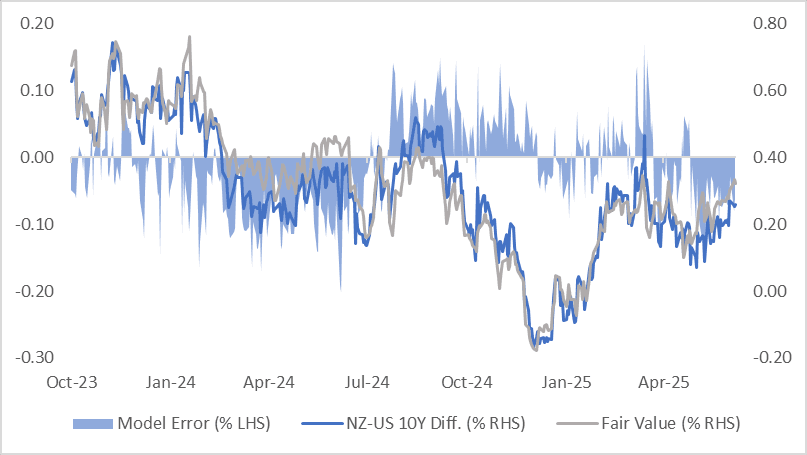
Source: Bloomberg Finance LP / MNI