NEW ZEALAND: ANZ Business Confidence & Activity To Fresh Cycle Highs
ANZ's business confidence and activity measures for New Zealand rose strongly in Dec. Activity is at 60.9 from 53.1 prior, while confidence is up to 73.6, from 67.1 in Nov. These are cycle high readings for both indices and points to growing optimism around the economic outlook. The chart below plots the activity measure, the white line, against y/y NZ GDP growth (which only printed for Q3 yesterday). There is by no means a perfect relationship between the two series, but such levels in business activity (and confidence) usually coincide with higher levels of y/y GDP growth or at least upward momentum. Today's ANZ prints (with consumer confidence also up earlier) will reinforce an on hold RBNZ in the first part of 2026. Market reaction has been limited though, NZD/USD holds a touch weaker for the session (last 0.5700/75), while the 2yr swap rate and onshore bond yields are still down for the session (NZGB yields around 2-4bps weaker).
- All the sub components from the survey improved, with residential and commercial construction up noticeably. The employment index rose to 27.5, from 18.5.
- Inflation expectations were unchanged at 2.69%, while via BBG: "while a net 51.7% of firms expect to raise prices, vs 50.5%." The local bank also noted: “The 2024 slowdown was deliberately induced by monetary policy, and now that that has eased, there is not a lot else holding the economy back”: ANZ (via BBG).
Fig 1: ANZ Business Activity & NZ GDP Y/Y
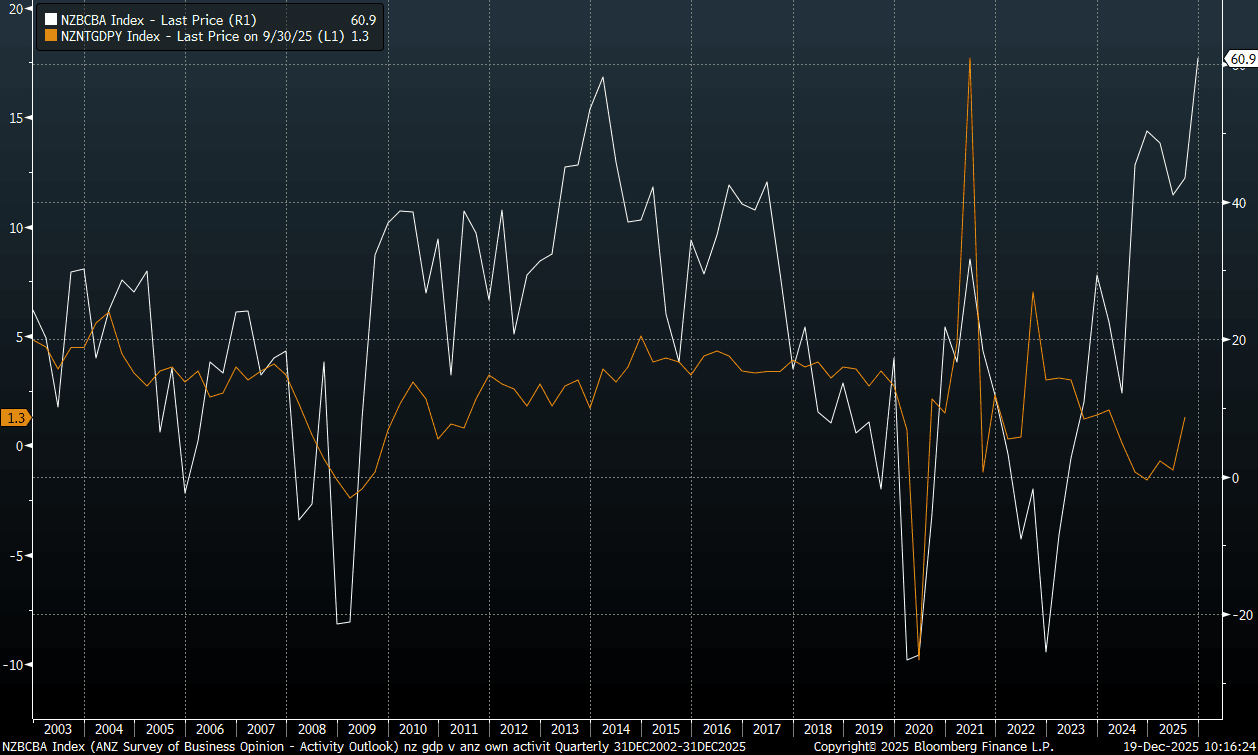
Source: Bloomberg Finance L.P./MNI
Want to read more?
Find more articles and bullets on these widgets:
Historical bullets
AUSTRALIA DATA: Westpac Lead Indicator Consistent With Ongoing Recovery
The Westpac leading index rose 0.11% in October up from -0.01% bringing the 6-month annualised rate to 0.35% from 0.1%. The increase was due to stronger consumer confidence. The 6-month rate leads detrended growth by 3-9 months and so is consistent with the recovery gaining into H1 2026. The index had been around neutral since April, when the US announced reciprocal tariffs.
- Westpac expects the RBA to resume easing policy in May and August next year bringing rates back to around “neutral” as there will be enough inflation data by then to show it has moderated again.
- It is forecasting growth to improve to 2.4% y/y over 2026 from Q2’s 1.8% y/y. Recently RBA Deputy Governor Hauser said that trend growth is expected to be around 2% over the rest of the 2020s. Stronger-than-expected growth is a risk to the RBA’s forecast of core inflation trending back towards the band mid-point.
- Since April, consumer sentiment, Australian equities and hours worked have driven the recovery in the lead index. There is likely to be payback for the November jump in confidence and given the size of the rally in stocks, there could be a correction.
Australia Westpac lead indicator 6m/6m annualised %
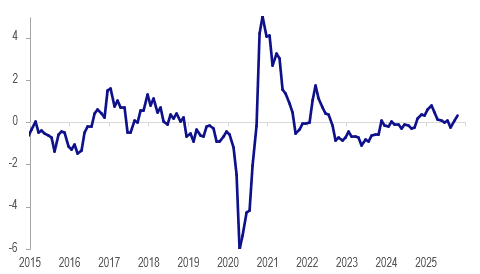
Source: MNI - Market News/LSEG
JAPAN: Nikkei(NHZ5) - Finds Bids Around 48500 Initially, Can This Hold ?
The Nikkei(NHZ5) contract overnight range was 48410 - 49110, The Nikkei 225 closed yesterday, -3.2%. The futures have found some demand just below 48500 as it tried to break the downward momentum, it opened lower in Asia around 48550, -0.65%. The Market technically remains in an uptrend while the support toward 48000 holds, albeit a very steep one. The lower high put on the Daily chart and the headwinds for global risk do give me pause though, in this session I would be looking to see if this support can hold and then look to fade a bounce into the 49500-49800 area if given the chance. A sustained break back below 48000 turns the focus back toward the 45000-46000 area.
- The Nikkei 225 Index Average True Range(ATR) for the last 10 Trading days: 900 Points
Fig 1: Nikkei 225 Daily Chart
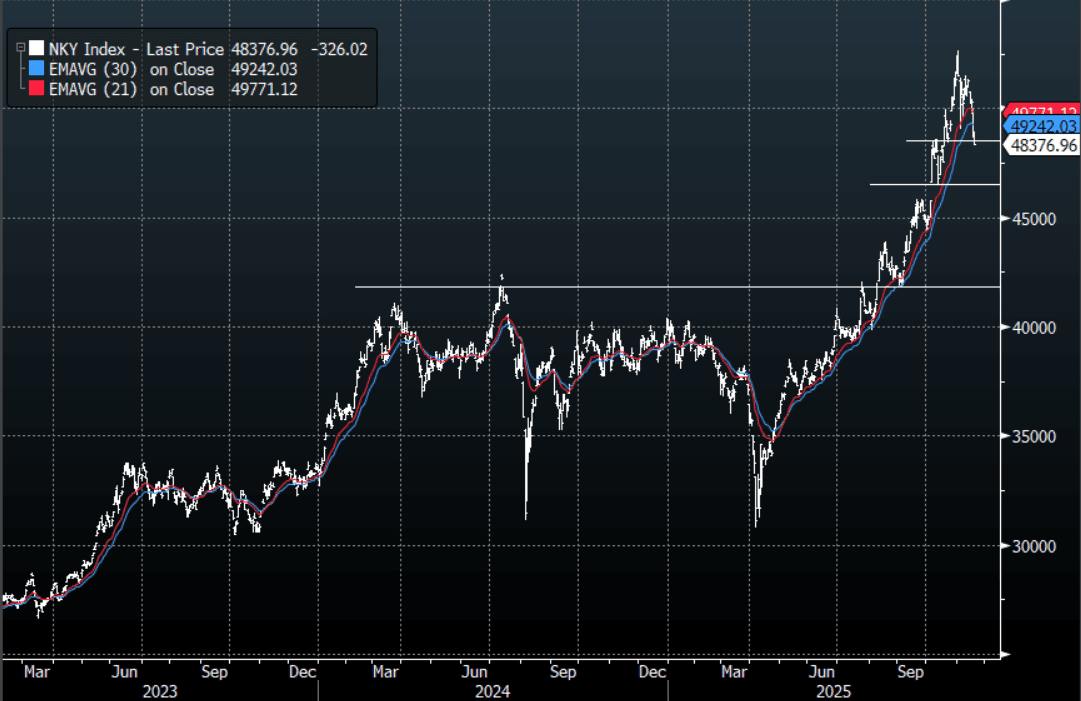
Source: MNI - Market News/Bloomberg Finance L.P
JAPAN DATA: Core Machine Orders Surge, Reinforcing Positive Capex Backdrop
Japan Sep core machine orders were comfortably above market forecasts, although arguably this was a risk after the recent Q3 GDP preliminary print (which showed stronger than expected business spending in Q3). From a policy makers standpoint, it suggests resilience/strength in the business/capex sector (reinforcing what the Q3 GDP print stated). Focus will be on if these trends sustain into Q4, while the wage outlook is also a key BoJ watchpoint. Our policy team notes that key wage data will not be available until the Jan policy meeting next year. This sets up a possible Dec hold from the BoJ (although sharp yen weakness could prompt a move).
- Core machine orders rose 4.2%m/m in Sep (versus a 2.0% forecast and -0.9% prior). In y/y terms, we rose to 11.6%, versus 4.7% forecast and 1.6% prior. This is the strongest y/y print since 2022. The chart below plots this series (the white line) against Japan capex, ex software (also in y/y terms) (the orange line). This bodes well for Q3 capex, which prints at the start of Dec.
- In terms of the detail from today's print, foreign orders were quite strong and are now up 37.9%y/y. Manufacturing orders rose 30.1%y/y.
Fig 1: Japan Core Machine Orders & Japan Capex (Ex Software) Y/Y
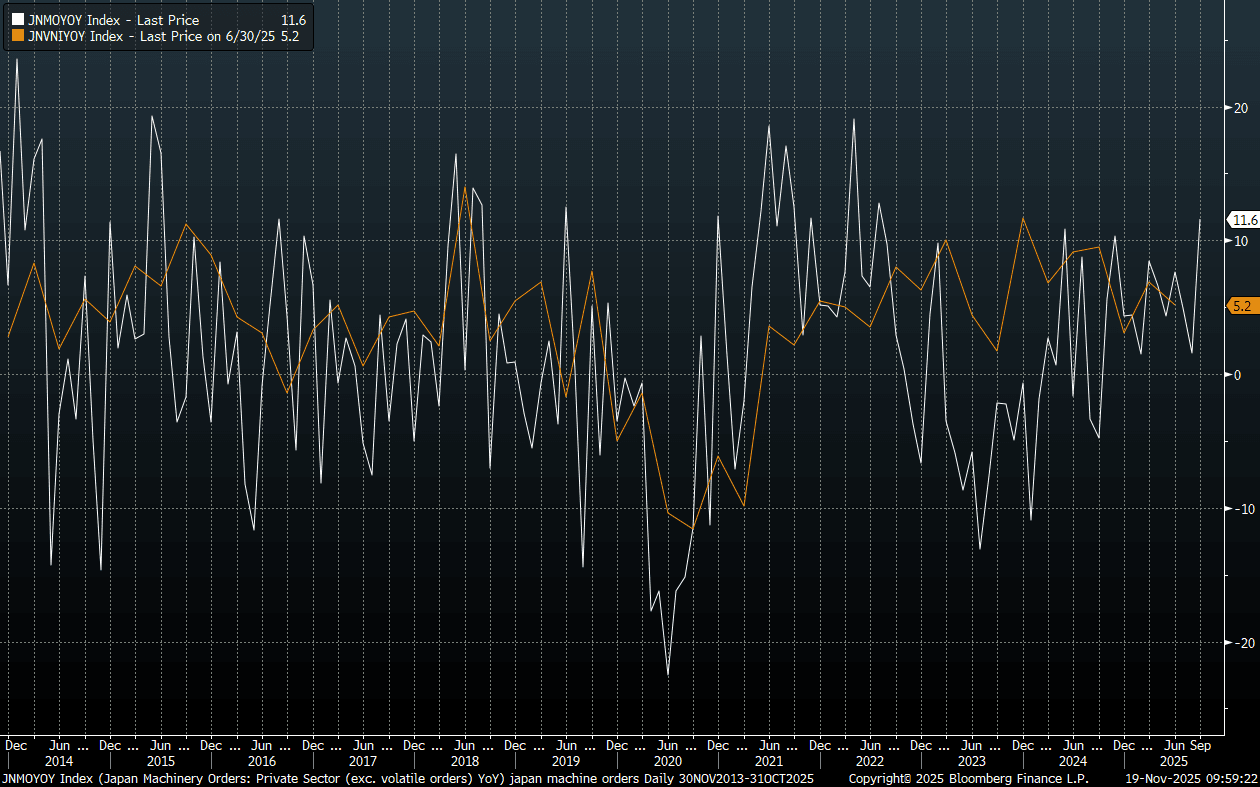
Source: Bloomberg Finance L.P./MNI