US DATA: Analysts Lament "Mess" Of A CPI Report, Revise Down PCE Tracking
Analysts have sharply downwardly revised expectations for core PCE in October and November following the CPI report. All acknowledge that the downside surprise to key aggregates was probably driven by serious methodological issues/choices that may reverse to the upside in the coming months. As such the Fed is unlikely to take the data seriously or literally when deciding whether a follow-up cut is appropriate at its January meeting, preferring to take more signal from the December report due out in mid-January. A few selected comments:
- Morgan Stanley: "The downside surprise reflects weakness in both goods and services, but may be partly due to methodological issues. The BLS might have carried forward prices in some categories, effectively assuming 0% inflation. If these technical factors are the main source of weakness, we could see reacceleration in December...While we anticipated a seasonal drag on OER, the 0.13% m/m average pace in Oct/Nov cannot be explained by seasonals alone. Limited data and carry forward assumptions may have introduced a downward bias...we now forecast core PCE inflation increased 0.128%m/m on average in October and November...We were previously tracking core PCE at 0.28% average Oct/Nov, the 15bp downward revision is explained by both lower-than-expected core goods (-6bp), and core services (-9bp)."
- Jefferies: "We need to acknowledge that this data is a mess...Taken at face value, this report and the increase in the unemployment rate through November should increase the odds of further rate cuts in 2026. However, the lack of detail in the data and the varied treatment of certain missing data points creates a general sense of uneasiness and distrust in the data. "Clean" reports in December will be key to putting these October and November reports into the proper context."
- Nomura: "We expect missing October data and the unusual timing of November data collection drove a downward bias in CPI estimates. This is likely to lead to positive payback in December, January, and April....Weakness was broad-based, with outsized underperformance in rents, airfares, and core goods, which tend to be discounted during the holiday season...The BEA has yet to announce how it will handle the October data subjected to carry-forward imputation. However, we expect the BEA to assume zero inflation for those components, and this would likely lead core PCE inflation to slow to 0.102% m-o-m for October. We have also revised down our November core PCE tracking estimate slightly to 0.227% m-o-m (from our prior estimate of 0.252%)."
- TD: "We are skeptical regarding how much substance we can get from the November report given the well telegraphed issues around the collection of data in October and November. It seems to us that the BLS made a number of methodological judgments for October and November that resulted in a downward bias for consumer prices...Consequently, we would advise market participants to look through the November report's dovish signal, and wait for what's likely to be more reliable December numbers. We think Fed officials will probably aim to do the same."
- Wells Fargo: "Data issues aside, our belief is that inflation is slowing on trend, even if today's print overstates the slowdown. When paired with the softening in the labor market, we remain comfortable with rate cuts in March and June of next year. At that point, we believe cleaner data will give the Committee more confidence that inflation is leveling off and will soon be moving back toward 2%."
Want to read more?
Find more articles and bullets on these widgets:
Historical bullets
MNI: US TSY TICS NET FLOWS IN SEP +$190.1B
- MNI: US TSY TICS NET FLOWS IN SEP +$190.1B
- US TSY TICS NET L-T FLOWS IN SEP +$179.8B
USDCAD TECHS: Bearish Theme
- RES 4: 1.4200 Round number resistance
- RES 3: 1.4170 Channel top drawn from Jul 23 low
- RES 2: 1.4140/67 High Nov 5 / 50.0% of the Feb 3 - Jun 16 bear leg
- RES 1: 1.4062 Intraday high
- PRICE: 1.3996 @ 16:45 GMT Nov 18
- SUP 1: 1.3985 Low Nov 13
- SUP 2: 1.3968 50-day EMA
- SUP 3: 1.3893 Bull channel base drawn from the Jul 23 low
- SUP 4: 1.3888 Low Oct 29 and a key support
The short-term outlook in USDCAD is bearish. Price action is trading inside a bull channel drawn from the Jul 23 low. The top of the channel - currently at 1.4170 - provided a firm resistance on Nov 11. The subsequent move down highlights scope for a bear extension towards the base of the channel at 1.3893. Initial key support to watch is 1.3968, the 50-day EMA. For bulls, a break of the channel top would confirm a resumption of the uptrend.
AUD: AUD/USD - Support Toward 0.6450 Holds As Risk Stabilises
The AUD/USD had a range overnight of 0.6474-0.6518, Asia is trading around 0.6510. Risk has stabilised overnight recovering off its lows albeit ending lower on the day. The AUD/USD again found very good support back toward the 0.6450 area and has moved back above 0.6500 as US stocks recover into the close. Bitcoin had a look below the pivotal $90k area and strong demand has seen the support hold on the first attempt, the markets focus for risk will now turn toward the Nvidia results which come out in the US session. The AUD/USD continues to chop around within its 0.6350-0.6650 range, its first support back toward 0.6440-0.6460 which has been pretty solid the last couple of months, then 0.6350 below that. It would need this move lower in risk to accelerate and become something more significant to challenge down there I would think.
- MNI BRIEF:RBA Outlines Factors That Will Drive Pause - Minutes. Stronger demand, reduced supply capacity and signs that the 3.6% cash rate may not be as restrictive as previously thought could lead the Reserve Bank of Australia to hold rates at coming meetings, minutes of the Board’s November session showed Tuesday.
- Options : Closest significant option expiries for NY cut, based on DTCC data: 0.6500(AUD640m), 0.6300 (AUD445m). Upcoming Close Strikes : 0.6550(AUD2.28b Nov 21) - BBG
- The AUD/USD Average True Range for the last 10 Trading days: 48 Points
- Data/Event: Westpac Leading Index, Wage Price Index
Fig 1: AUD/USD spot Daily Chart
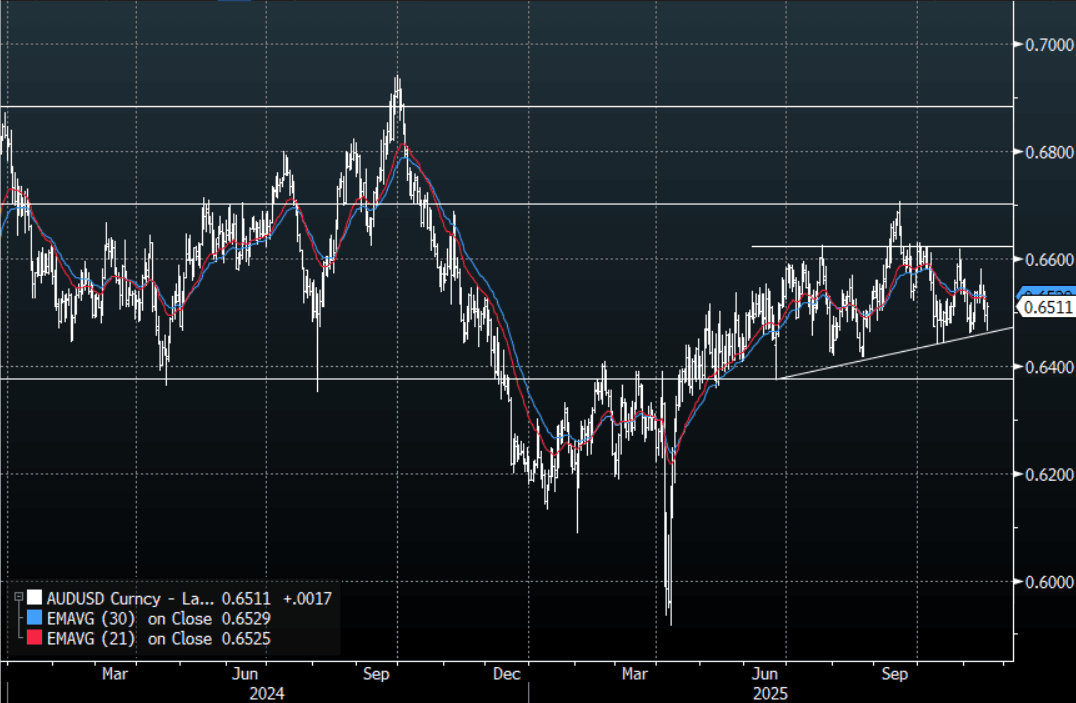
Source: MNI - Market News/Bloomberg Finance L.P