US DATA: A Broadly Disappointing ISM Manufacturing Survey For October
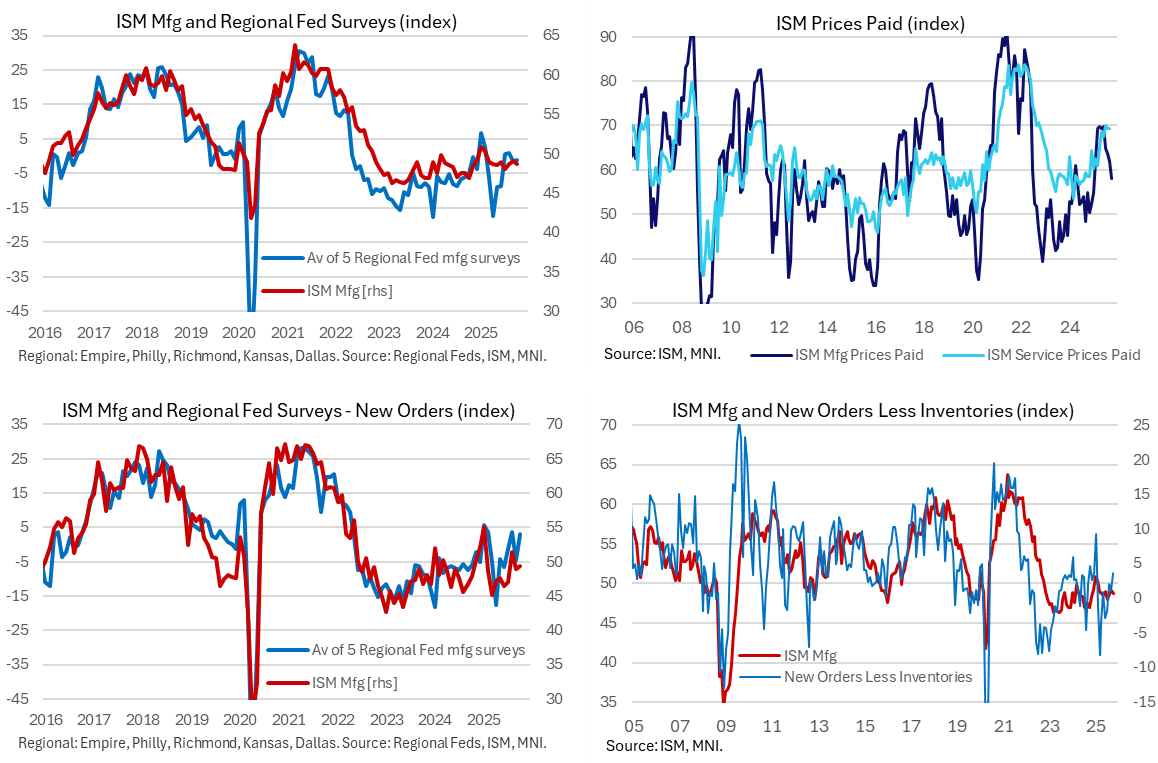
The ISM manufacturing survey for October underwhelmed across the board, undershooting implications from regional Fed surveys, the MNI Chicago PMI and what continues to be a much more optimistic S&P Global PMI. New orders disappointed a bounce seen elsewhere and prices paid fell to the lowest since January, although new orders less inventories did at least point to upside for manufacturing activity ahead.
- ISM manufacturing: 48.7 in Oct (cons 49.5) after 49.1 in Sep
- New orders: 49.4 in Oct after 48.9 in Sep. The small 0.5pt increase after the -2.5 drop in September is disappointing considering the regional Fed surveys along with the MNI Chicago PMI had pointed to a solid bounce in new orders.
- Interestingly however, inventories didn’t echo the sharp increase from the S&P Global US PMI (its sharpest increase since the data started in 2007) but instead fell 1.9pts to 45.8 for the lowest since Oct 2024. That in turn meant that the new orders less inventories metric increased to 3.6 for its highest since January, at least implying some upside to manufacturing activity ahead.
- Prices paid: 58.0 in Oct (cons 62.5) after 61.9 in Sep. Consensus came from a typically limited survey of six analyst estimates but had looked reasonable considering the regional Fed surveys were on average were little changed on the month whilst continuing to run at higher outright levels.
- Prices are an area where the ISM report is more in line with the PMI, with prices paid at their lowest since January vs February in the PMI.
- Employment: 46.0 in Oct after 45.3 in Sep, marking a third consecutive increase for its highest since May but still firmly in contraction territory. The index has been in expansionary territory (>50) in just two months of the past two years, with a high in that period of 50.4. We put much more weight on the ISM services survey for this component.
Want to read more?
Find more articles and bullets on these widgets:
Historical bullets
USDCAD TECHS: Fresh Cycle High
- RES 4: 1.4111 High Apr 10
- RES 3: 1.4045 3.0% Upper Bollinger Band
- RES 2: 1.4019 38.2% retracement of the Feb 3 - Jun 16 bear leg
- RES 1: 1.3989 200-dma
- PRICE: 1.3953 @ 16:02 BST Oct 3
- SUP 1: 1.3897/3825 Low Sep 30 / 50-day EMA
- SUP 2: 1.3727 Low Aug 29 and a bear trigger
- SUP 3: 1.3689 Low Jul 28
- SUP 4: 1.3637 Low Jul 25
A bull cycle in USDCAD remains intact and yesterday’s break above the late September’s high, firms the bullish theme. This move higher also maintains the bullish price sequence of higher highs and higher lows. Note too that moving average studies are in a bull-mode position, highlighting a dominant uptrend. Sights are on 1.4019, a Fibonacci retracement point. On the downside, first key support lies at 1.3825, the 50-day EMA.
AUDUSD TECHS: Support Remains Intact For Now
- RES 4: 0.6763 1.382 proj of the Jun 23 - Jul 24 - Aug 21 price swing
- RES 3: 0.6726 1.236 proj of the Jun 23 - Jul 24 - Aug 21 price swing
- RES 2: 0.6660/6707 High Sep 18 / 17 and key resistance
- RES 1: 0.6629 High Sep 30 & Oct 01
- PRICE: 0.6603 @ 16:01 BST Oct 3
- SUP 1: 0.6527/21 61.8% of the Aug 21 - Sep 17 bull leg / Low Sep 26
- SUP 2: 0.6484 76.4% retracement of the Aug 21 - Sep 17 bull leg
- SUP 3: 0.6463/6415 Low Aug 27 / Low Aug 21 / 22 and a bear trigger
- SUP 4: 0.6373 Low Jun 23
The AUDUSD uptrend remains intact and recent weakness appears to have been a correction. Support to watch lies at the 50-day EMA, at 0.6558. A clear break of this average would signal scope for a deeper retracement and expose 0.6527 once again, a Fibonacci retracement. For bulls, a stronger reversal higher would refocus attention on 0.6707, the Sep 17 high. Initial resistance to watch is 0.6629, the Sep 30 and Oct 1 high.
US TSYS/SUPPLY: September's Coupon Auctions Were Generally Solid (2/2)
September’s coupon auctions were generally solid, with three lines trading through, two coming out on the screws and two tailing slightly.
- Looking through the lens of MNI’s Relative Strength Indicator (RSI), five lines saw positive readings while two saw negative readings.
- The 3-year sale was the strongest auction of the month according to MNI’s RSI. The 3-year line traded through 0.7bps, the largest stop through in seven months. Meanwhile, the primary dealer take-up was just 8.4%, the lowest on record (data going back to 2003).
- The weakest sale of the month was the last – the 7-year line. This line saw the second consecutive 0.5bp tail, with the 12.0% primary dealer take-up above August’s 9.8% and July’s record low 4.1%.
September Auction Review:
- 2Y Note on-the-screws: 3.571% vs. 3.571% WI.
- 2Y FRN: 0.200% high margin vs. 0.195% prior
- 3Y Note trade-through: 3.485% vs. 3.492% WI.
- 5Y Note tail: 3.710% vs 3.709% WI.
- 7Y Note tail: 3.953% vs. 3.948% WI.
- 10Y Note trade-through: 4.033% vs. 4.047% WI.
- 10Y TIPS: 1.734% high yield vs. 1.985% prior
- 20Y Bond trade-through: 4.613% vs 4.615% WI.
- 30Y Bond on-the-screws: 4.651% vs. 4.651% WI.
