COMMODITIES: WTI Futures Test 20-Day EMA Support Again, Bull Cycle Intact
A bull cycle in WTI futures remains intact. However, the move lower from the Jan 29 high continues to highlight a corrective phase. Attention is on support at the 20-day EMA, at $62.61 (pierced). The 50-day EMA lies at $60.95. A clear breach of the 50-day average would highlight a stronger reversal and open $58.53, the Jan 20 low. Key resistance and the bull trigger has been defined at $66.48, the Jan 30 high. Clearance of it would resume the uptrend. Recent gains in Gold highlight a retracement of the Jan 29 - Feb 2 sell-off. The next two resistance points to monitor are $5139.9 and $5314.0, Fibonacci retracement levels. Note that the sell from the Jan 29 high continues to highlight a potential top in the L/T trend and from a S/T perspective, an unwinding of the recent overbought condition. A resumption of bearish activity would refocus attention on $4403.0, Feb 2 low.
- WTI Crude up $0.6 or +0.95% at $63.45
- Natural Gas down $0.13 or -4.04% at $3.108
- Gold spot down $56.63 or -1.13% at $4936.21
- Copper down $8.3 or -1.42% at $577.7
- Silver down $1.67 or -2.18% at $74.9726
- Platinum down $36.71 or -1.8% at $2008.48
Want to read more?
Find more articles and bullets on these widgets:
Historical bullets
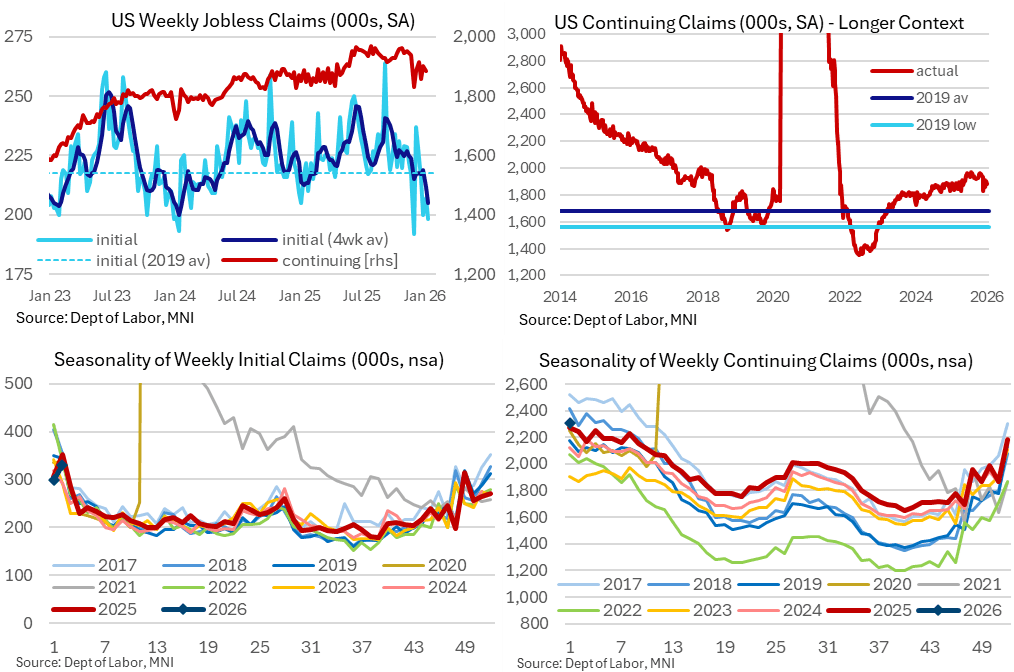
US LABOR MARKET: Macro Since Last FOMC: No Sign Of Alarm In Jobless Claims [3/3]
- Away from the top tier BLS labor releases, weekly jobless claims have been of note in recent weeks as initial claims have consistently pushed lower.
- There are concerns over residual seasonality here, which could start to see increases heading into February, but levels are nevertheless particularly low with a four-week average at its lowest since Jan 2024.
- Continuing claims have also held their pulling back from cycle highs seen throughout June-October, suggesting that re-hiring conditions may have cooled when looking at a long-term trend but that conditions have at least improved compared to the summer and fall.
- These claims data clearly point to a labor market in an unusual low fire, low hire state, which appears to give some on the FOMC more concern than others.
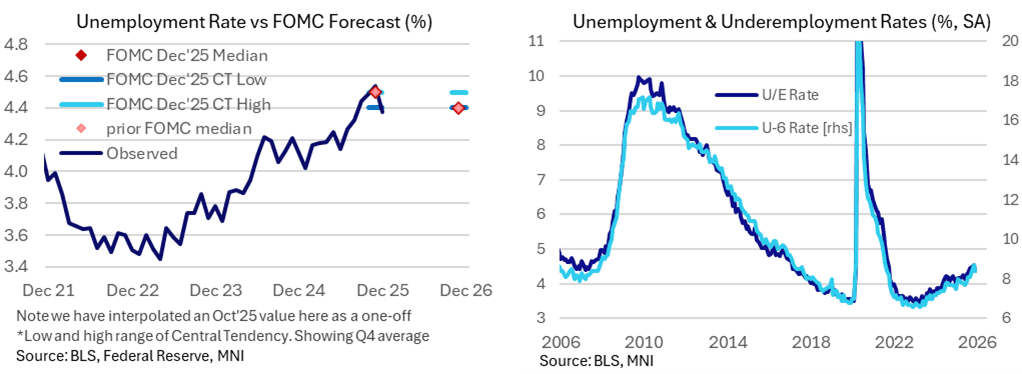
US LABOR MARKET: Macro Since Last FOMC: U/E Rate Lower, Hits Median Fcast [2/3]
- Looking to the household survey for a better sense of labor market balance, the unemployment rate stood at 4.38% in December to placate fears of further deterioration.
- It more than unwound a push higher to 4.54% in November (revised from 4.56% first reported before annual seasonal adjustment revisions) having been 4.44% in September (unrevised) in the latest update prior to the December FOMC meeting.
- NY Fed Williams had estimated after the delayed release of the November report that it might have been overstated by 0.1pp and Fed Chair Powell had specifically warned of its potential technical distortions ahead of time.
- We’re left with an average unemployment rate of 4.47% in Q4 (using an interpolated value for Oct with no household survey conducted) to match the 4.5% the median FOMC participant forecast in the Dec SEP.
- In doing so, it importantly ruled out a further increase to 4.6-4.7% that seven members had pencilled for what’s an increasingly divided committee. Nevertheless, there has been a clear uptrend in the second half of the year having averaged 4.15% in 1H25.
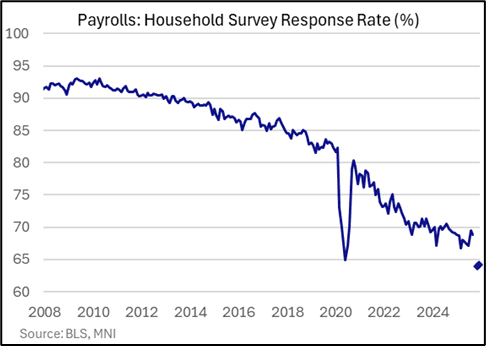
- Data quality concerns are still elevated though, particularly with the household survey response rate barely increasing from November’s record low.
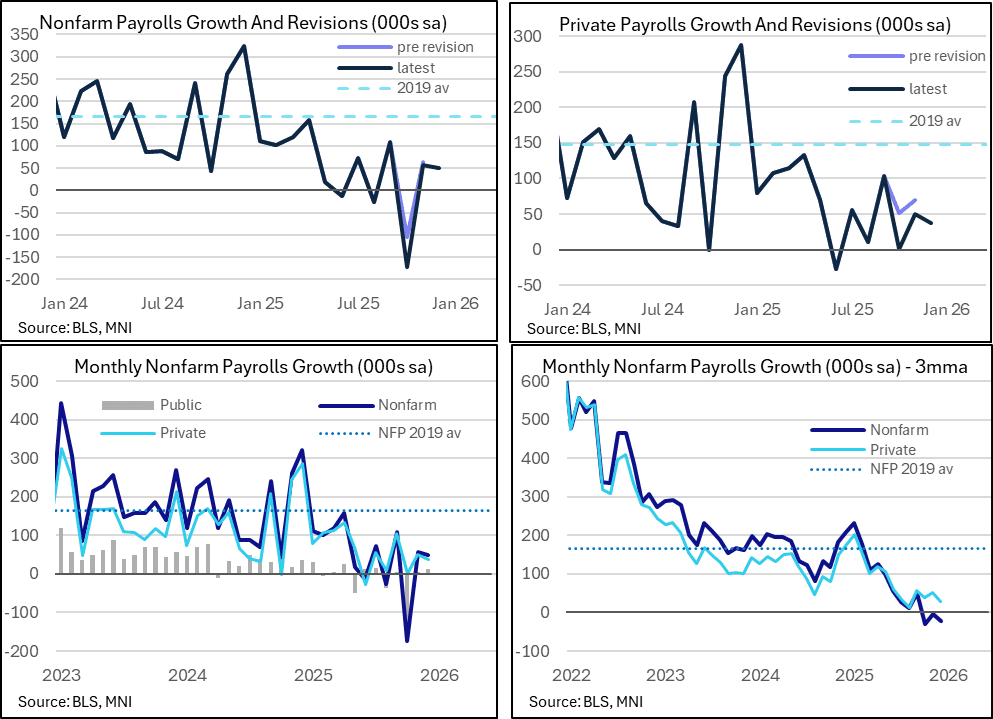
US LABOR MARKET: Macro Since Last FOMC: Payrolls Slowly Rise After Oct Hit [1/3]
We take an early look at what economic data the FOMC has received since the Dec 9-10 meeting, starting with the labor data where it's had a huge amount to assess along with various distortions to consider.
- Having received three months of data within two BLS nonfarm payrolls reports, the FOMC is left with two latest months of subdued but at least resilient nonfarm payrolls growth of 50k/56k in Dec/Nov. That’s right around estimates of the recent breakeven pace such as the St Louis Fed’s range of 30-80k.
- It does however follow a hugely weak -173k in October, on DOGE-driven federal government deferred resignations showing up with a -174k hit but with the private sector exhibiting weakness as well in October with just a 1k increase.
- For a better sense of underlying jobs growth, private payrolls increased an average 29k over three months to December but strip out the ever-large contribution from the cyclically insensitive health & social assistance sector and private payrolls would have averaged -19k, with only one of the past eight months seeing net job creation.
- We suspect colder than usual weather had a modestly adverse impact on the December data, with the 37k private sector jobs growth potentially understated specifically on that front, but it’s unlikely a big needle mover and an impact that is likely dominated by regular revisions as more data comes in.
- Whilst broadly expected, recall that annual benchmark revisions, due with the January report to be released in February, are also set to show significant downtrend revisions to payrolls, such that payrolls growth is perhaps overstated by about 60k per month.