EMISSIONS: US Threaten Countries Who Vote For Maritime Carbon Levy With Tariffs
The US has reportedly warned countries to reject a IMO’s carbon levy or risk facing tariffs, port levies, and visa restrictions, ahead of the voting to adopt the net-zero proposal in October, according to Reuters.
- The US has previously rejected the IMO’s carbon levy formally on 13 Aug and threatened measures against countries that support it, according to the US government.
- The UN’s passed the plan to introduce a minimum $100/ton CO2e carbon levy on shipping emissions exceeding new decarbonisation targets, to take effect by 2028.
- The US previously walked out of the IMO meeting on the net-zero framework in April, of which 63 member states including China, Brazil and EU countries voted in favour, while only 16 states voted against.
- Maritime transport around 80% of world trade and account for nearly 3% of the world's carbon emissions, according to Reuters.
Want to read more?
Find more articles and bullets on these widgets:
Historical bullets
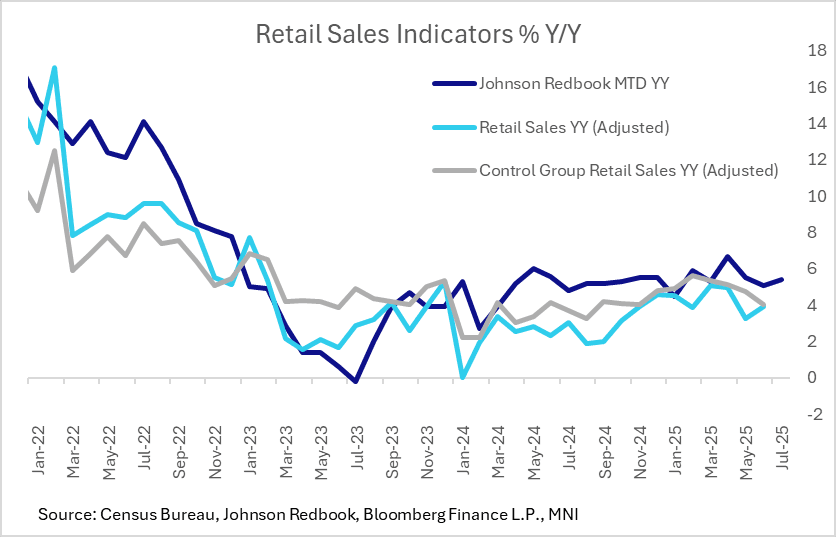
US DATA: Redbook Posts Another Solid Month Of Retail Sales Gains In July
July's full-month retail sales came in at 5.4% Y/Y per the Johnson Redbook retail sales index, following a 6.5% Y/Y rise in the final week of the retail month (to Aug 2).
- While more details will be available on Wednesday after the same-store sales index is released, it appears as though July continued a string of robust Redbook sales (6 months consecutive, and 11 in 12, above 5% Y/Y).
- Additionally, Redbook's preliminary forecast for August is for 5.8% Y/Y sales.
- Current estimates for Jul Census Bureau retail sales (out Aug 15) is for 0.5% M/M gains after 0.6% in June, which would put Y/Y sales in the high 3% Y/Y area.
- The Redbook report's anecdotals point to promotions and sales tax holidays as having boosted late July sales: "shoppers took advantage of annual sales tax holidays for school supplies and clothing in Arkansas, Florida, Iowa, New Mexico, Ohio, South Carolina, Tennessee, Virginia, and West Virginia. Retailers also provided a variety of promotions, both in stores and online. Meanwhile, some major retailers are facing a nationwide boycott organized by People’s Union USA, which began on August 1st and will continue throughout the month."
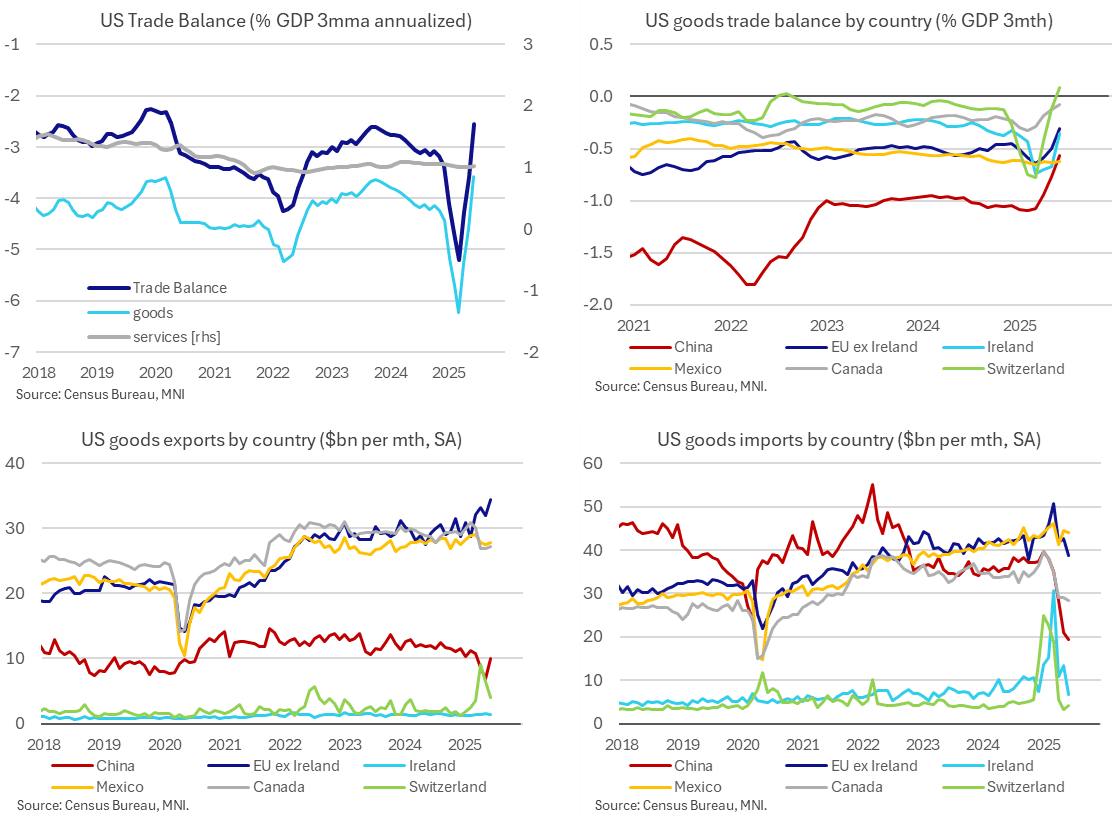
US DATA: US-China Goods Deficit At Smallest Since At Least 2009
There weren’t any major surprises in the final goods & services trade data for June as last week’s surprisingly small goods deficit in the advance report had already set the tone. US trade deficits with both the EU and China narrowed further, with the goods deficit to China of 0.6% GDP in Q2 the lowest quarterly deficit since at least 2009.
- The goods & services trade deficit was close to expectations in June at $60.2bn (cons $61bn) after a near unrevised $71.7bn (initial $71.5bn) in May, after last week’s advance release just for goods had suggested similar.
- The goods & services deficit was equivalent to 2.5% GDP in Q2 after 5.2% GDP in Q1. That’s vs 3.4% GDP in Q4 or 3.1% GDP across 2024. Swings have come entirely from the goods deficit whilst the services surplus has been steady around 1.0% GDP.
- These low recent deficits are payback from the huge deficits of Dec and Q1 driven by tariff front-running, primarily gold and then pharmaceutical products.
- The goods deficit with the EU has narrowed to 0.7% of US GDP in Q2 vs 1.4% GDP in Q1 and 0.8% GDP in Q4, whereas the goods deficit with China has narrowed to 0.6% GDP in Q2 vs 1.1% GDP in Q1 and 1.0% GDP in Q4.
- Today’s details also show that June’s latest moderation in deficits, a surprise at the time of the advance release, was indeed driven by pharmaceutical imports (-36% M/M). At $17.1bn in June, pharma imports fell from $26.7bn in May as they continued to retrace from a huge peak of $50.2bn in March, having averaged $20.5bn in 2024 for context.
- Ireland has contributed heavily to these pharma flows (all imports from Ireland halved in June to $6.7bn) but imports from EU ex Ireland also eased from $42.7bn to $38.7bn (second lowest since mid-2022 for a nominal measure). This is down from $42.9bn in December.
- Imports from China saw a smaller decline on the month but have seen a more pronounced trend decline under the second Trump administration, most recently at $19.4bn in June after $20.9bn in May and $37.3bn in December.
- Exports have increased strongly over that period to the EU but less so for China. Exports to the EU increased to $35.8bn in June from $33.5bn in May and $30bn in Dec, whilst exports to China increased to $10.1bn from a particularly low $6.9bn in May (as trade flows slowed significantly in lagged response to policies that essentially halted trade between the two countries) and $11.5bn in Dec.
SOFR OPTIONS: Morning Update SOFR Call Buyers Fade Morning Dip
- +20,000 SFRZ5 96.25/96.37/96.50/96.62 call condors, 2.75 ref 96.26
- +10,000 SFRU5 96.12/96.18 call spds .87
- +10,000 SFRU5 96.18/96.25 call spds .62
- -5,000 SFRU6 95.87 puts, 6.0
- +1,500 SFRZ5 96.25 straddles, 33.5