US TSYS: Tsys Gap Higher on Weak Jobs Data, Rate Cut Pricing Surges
Aug-01 19:18
- Treasury futures gapped higher after lower than expected jobs gain for July, June gains sharply down-revised, while unemployment rate held steady.
- Nonfarm payrolls growth was weaker than expected in July at 73k (cons 104k) after huge downward revisions in both June (-133k to just 14k) and May (-125k to 19k). The downward revisions came from a combination of large shifts in both private and public payrolls, equally spread over both May and June.
- Treasury futures extending highs (TYU5 +1-03 112-05) after lower than expected ISMs, lower UofM sentiment while 1Y inflation expectations climbs slightly. The ISM manufacturing survey was weaker than expected in July at 48.0 (cons 49.8) after 49.0 in June, falling to its lowest since October. Prices paid saw the largest downside surprise, falling to 64.8 (cons 70.0 from 8 responses vs 60 for the headline) from 69.7 in June for its lowest since February.
- Tsy Sep'25 10Y futures continued to extend highs in late trade (112-07.5), next level in focus at 112-12+ High Jul 1 and a bull trigger.
- Headline risk at least partially discounted: Pre Trump said to deploy two nuclear submarines due to provocative statements of the Former President of Russia, Dmitry Medvedev. Trump to fire "Biden Appointee, Dr. Erika McEntarfer, the Commissioner of Labor Statistics" for today's soft employment data.
Want to read more?
Find more articles and bullets on these widgets:
Historical bullets
US OUTLOOK/OPINION: U/E Rate Seen Ticking Up To New Recent High In June
Jul-02 19:15
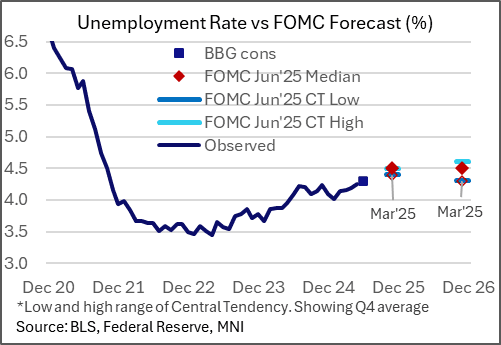
- In the household survey, the unemployment rate has increased for four consecutive months, albeit at a steady pace in the last three months, with the 4.244% in May its highest since Oct 2021.
- Analysts broadly expect this to tick higher to a rounded 4.3% in June but it of course doesn’t take much this month.
- There’s a good chance of a bounce back in employment and the labor force after very large declines in May, with employment falling -696k and the labor force -625k for their largest monthly declines since Dec 2023.
- That also left the participation rate at 62.37% (lowest since Dec 2022) and the employment to population ratio at 59.72% (lowest unrounded since Jan 2022).
- The extent of this likely bounce back adds uncertainty to estimates although the trend is expected to show a rising unemployment rate. Indeed, the median FOMC participant at the June SEP lifted their u/e rate forecast for 4Q25 from 4.4% to 4.5% and for 4Q26 from 4.3% to the same 4.5%.
- As for details, we’ll watch permanent job losers after they were steady in May at 1.92 million (rate of 1.12%) to suggest ongoing deterioration has stalled a little as well as a somewhat contradictory decline in job leavers in a sign of jobs market softness.
- As usual, there isn’t consensus for the underemployment rate after it was steady at 7.8% in May. Of note within that, those working part-time for economic reasons, a rise in which is typically considered a sign of weakness, dipped for a 2nd consecutive month in May (66k after 90k) to a 4-month low.
US TSYS/SUPPLY: June Auction Review: 5s Weak, 30s Strong
Jul-02 19:06
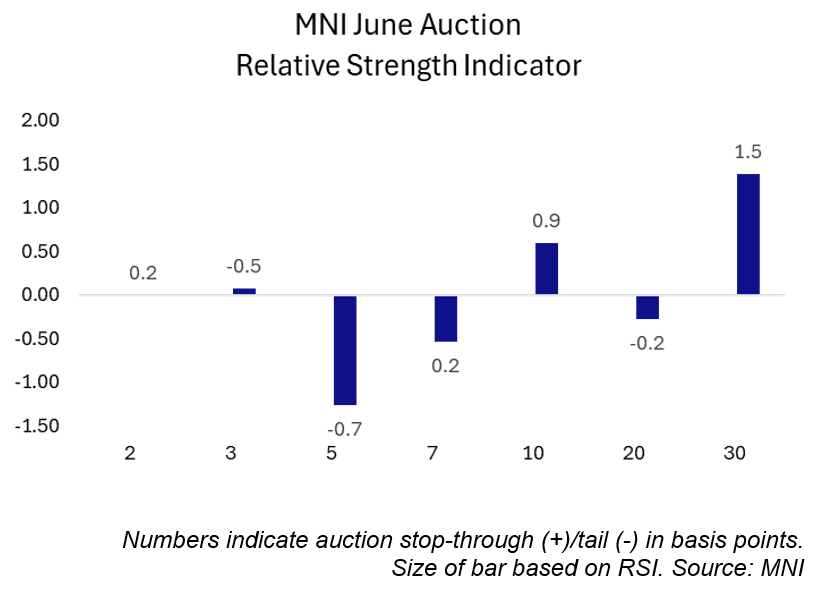
June’s Treasury coupon auctions were mixed, with four trading through and three tailing.
- The 30-year auction was the standout on the strong side, trading 1.5bps through. Meanwhile, the weakest auction was the 5-year sale, which tailed by 0.7bps.
- The 5-year Note tail was associated with a MNI Relative Strength Index (RSI) reading of -1.26, the weakest since October 2024. The primary dealer take-up of 11% was a touch above May’s 9%.
- Meanwhile, the 30-year Bond attracted an RSI of 1.39, well above May’s 0.15 but still below April’s 1.97 (the April sale saw a 2.5bp tail). Primary dealer take-up in June was nonetheless just 11%, the lowest since November 2024.
June Auction Review:
- 2Y Note trade-through: 3.786% vs. 3.788% WI.
- 2Y FRN: 0.157% high margin vs. 0.144% prior.
- 3Y Note tail: 3.972% vs. 3.967% WI.
- 5Y Note tail: 3.879% vs 3.872% WI.
- 5Y TIPS: 1.650% high yield vs 1.660% prior.
- 7Y Note trade-through: 4.022% vs. 4.024% WI.
- 10Y Note trade-through: 4.421% vs. 4.430% WI.
- 20Y Bond tail: 4.942% vs 4.940% WI.
- 30Y Bond trade-through: 4.844% vs. 4.859% WI.
EURJPY TECHS: Trend Set-Up Remains Bullish
Jul-02 19:00
- RES 4: 171.28 1.382 proj of the Feb 28 - Mar 18 - Apr 7 price swing
- RES 3: 171.09 High Jul 23 ‘24
- RES 2: 170.47 76.4% Fibonacci retracement for Jul - Aug ‘24 downleg
- RES 1: 169.91 1.236 proj of the Feb 28 - Mar 18 - Apr 7 price swing
- PRICE: 169.47 @ 16:23 BST Jul 02
- SUP 1: 168.46 Low Jul 01
- SUP 2: 167.41 20-day EMA
- SUP 3: 166.04 Low Jun 19
- SUP 4: 165.30 50-day EMA
The trend set-up in EURJPY remains bullish and the cross is trading just below its latest highs. Recent gains resulted in a break of 166.69, the Oct 31 ‘24 high. Scope is seen for a climb towards 170.47, a key Fibonacci retracement point. Note that the uptrend is in overbought territory, a pullback would unwind this condition. Support to watch lies at 167.41, the 20-day EMA. A break of the EMA would suggest potential for a deeper retracement.
Trending Top
Jun-26 16:22