CANADA DATA: Trade, Sales Data Point To Soft Early Q1 Activity
The latest January data showed mixed but on balance soft activity at the start of the year. To be sure, more important and up-to-date data going into the BOC's March meeting next week comes Friday with the February Labour Force Survey and manufacturing sales as well as Monday's Feb CPI report, but so far the "hard" data have been fairly weak versus decent survey data to begin 2026.
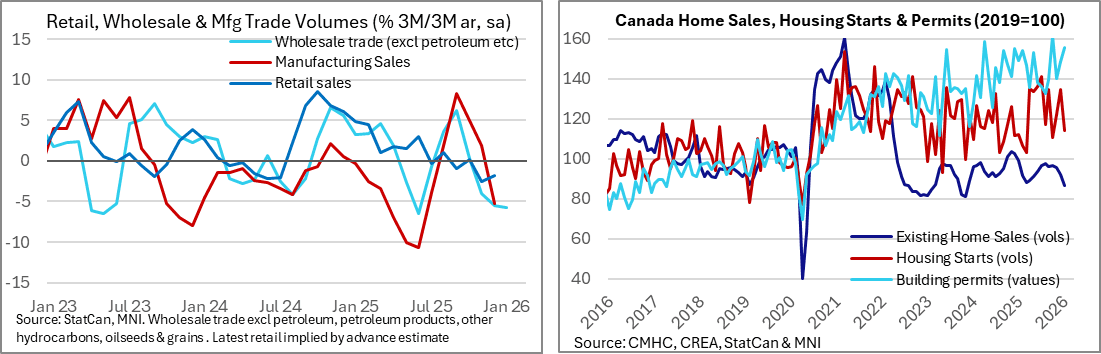
- Wholesale Sales: Core wholesale sales (ex petroleum, products, other hydrocarbons, oilseed & grains) fell by 1.0% in January, worse than the -0.6% advance estimate and the downwardly revised +1.8% prior (was 2.0%). This brought the 3M/3M annualized growth rate down to -1.7% from -1.6% in December for the weakest since the worst point of the US-Canada trade dispute impact (June 2025). On a volumes basis the reading was even worse, falling 5.8% 3M//3M for also the worst since June 2025. There are some volatile factors here to be sure, including a pullback in motor vehicles/parts sales (-3.9% after +9.2%) and mineral/ore/precious metal sales (-38.3% after +85.7%), but likewise there is no upside momentum evident in either nominal or volume terms.
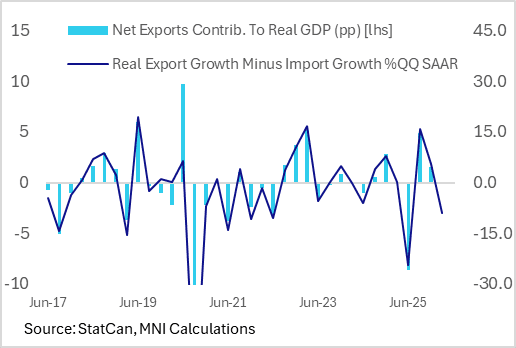
- Merchandise Trade: Latest international merchandise trade data showed a C$3.65B deficit in January, well above the C$1.10B expected (and C$1.30B prior). Exports fell 5.8% in volume terms, with motor vehicles/parts exports down 21.2% in nominal terms (to the lowest level since Sept 2021) as well as a 16% drop in aircraft/other transport shipments. The overall goods trade surplus with the US narrowed slightly to C$5.4B from C$5.7B but widened with the rest of the world to C$9B from C$7B. Imports fell comparatively less - 2.2% in volume terms - meaning that so far in Q1, net exports are on pace to drag on GDP growth for the first time since Q2 2025.
- Building Permits: There was better news in building permits which rose 4.8% M/M for a second consecutive month in of decent gains (6.1% prior) to the highest level in nominal terms in 3 months, with both residential (1.8%) and non-residential (9.4%) permitting up. A pickup here has largely failed to translate into better residential housing start volumes over the last 2 years, though by the same token it suggests that there's no incipient downturn going into 2026.
Want to read more?
Find more articles and bullets on these widgets:
Historical bullets
US DATA: Retail Revisions And Control Group Miss Confirm Q4 PCE Slowdown
December's advance retail sales data was roundly weaker than expected, which in addition to lower revisions in prior months will likely mean a pullback in Q4 personal consumption expenditures estimates in the GDP accounts. Even prior to this report, January had been expected to be a weak month for retail sales given incoming indicators, so there will be concerns about the momentum of consumption going into 2025. And the report is in nominal terms, so in volume terms Q4 2025 suddenly looks to have been closer to flat instead of robust for core goods sales.
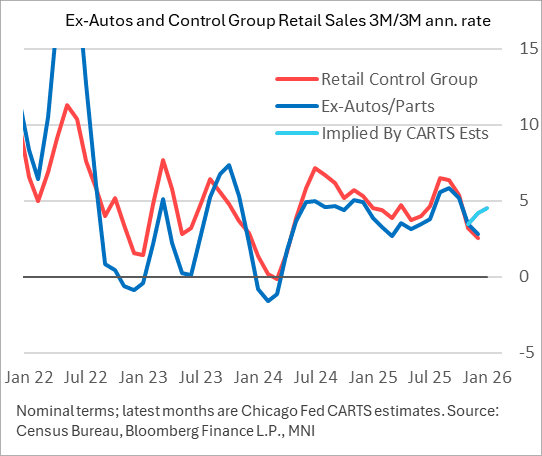
- The big surprise is that Control Group sales contracted 0.1% M/M in December vs expectations of a 0.4% expansion, for the first drop in 3 months alternate series including Chicago Fed CARTS had pointed to a decent rise. This was compounded by a downward revision to prior (0.2% from 0.4%) and a second consecutive downward revision to October, which originally printed 0.85%, then was revised down to 0.6%, and now to 0.4%.
- The latter will pull down the base effect for core retail sales growth in Q4 and looks likely to be met with a downgrade in Atlanta Fed GDPNow tracking of PCE of 3.07% Q/Q SAAR for overall consumption which would represent a slowdown from 3.5% prior. The first read of Q4 GDP is out February 20.
- The 3M/3M annualized rate of Control Group sales is now down to 2.6% in December, vs 6.4% at the end of Q3 (September). If you look at it on a Y/Y basis, sales growth is now just 3.4%, slowest in 19 months. The CARTS estimates in the chart below (which will be revised of course after this release) show how divergent the "actual" data were in December vs expectations.
- Indeed the report brought downgrades across the major aggregates, all of which also missed expectations in December: headline of 0.0% (actually slightly contractionary at -0.02% vs 0.4% survey, 0.4% prior rev from 0.5%) and ex-auto/gas of 0.0% (0.4% survey, 0.3% prior rev from 0.4%).
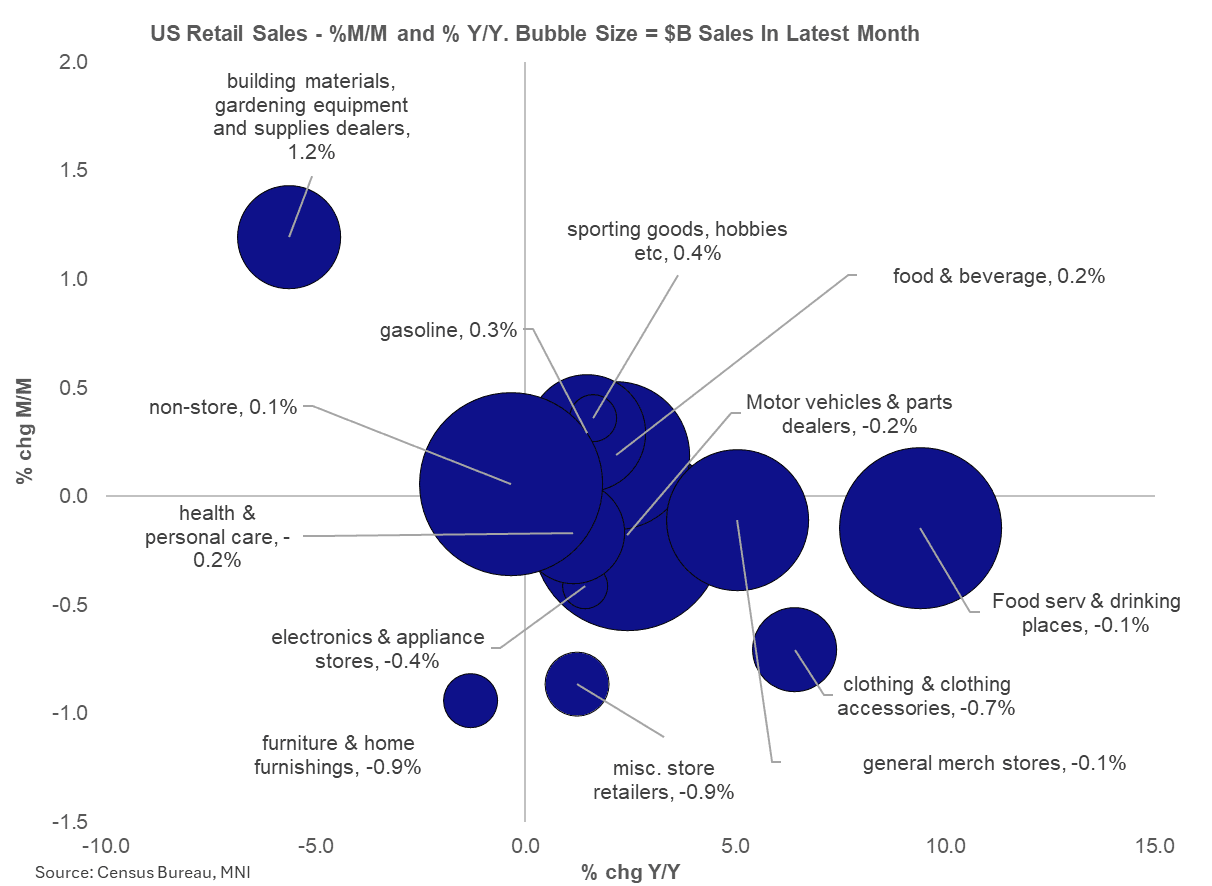
- Looking at the individual categories, December saw an unexpected contraction in vehicle sales (-0.2% M/M, the largest category of retail sales) and food services/dining places (-0.1% after +0.6%), each for the 2nd fall in 3 months (October too).
- Neither of these are in the control group, however: what we did see is broad weakness across major retailer categories, notably non-store (ie internet retailers) flatlining the last 2 months at 0.1% after 0.0% in November; this is the 2nd largest retail sales category and we can't help but note that revisions have been substantial the last couple of months. October was originally reported at +1.8% and November at +0.4%, those readings are now +0.7% and +0.0%, a major component in the overall downward revisions.
- Also general merchandise and miscellaneous stores saw a December contraction, not to mention clothing, furniture, electronics, and health/personal care. We saw a 2nd consecutive strong performance in building materials (1.2% in Nov and Dec) but this isn't in the Control Group.
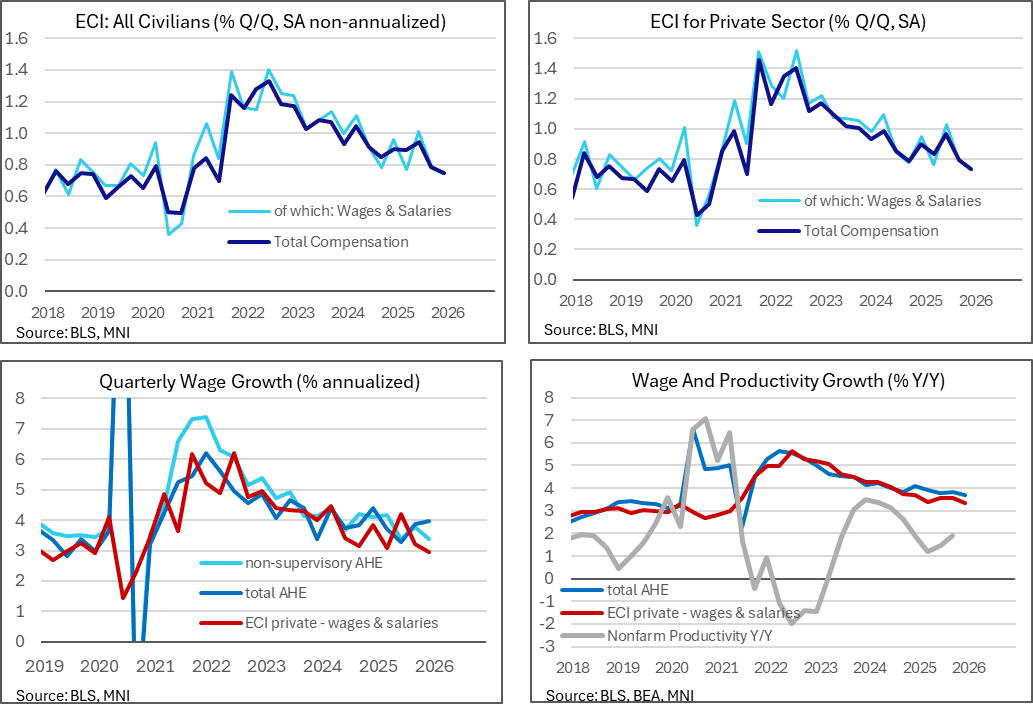
US DATA: Wage Growth Moderation Continued In Q4 ECI Report
The Q4 ECI update continued a trend moderation in wage growth. This more comprehensive wage growth metric, which the Fed puts much more weight on when it comes to assessing wage dynamics, offers a softer take than hourly earnings data in recent monthly payrolls reports.
- The employment cost index was on the soft side of expectations in Q4 as it increased 0.75% Q/Q non-annualized (cons 0.8) after 0.79%.
- It left annualized growth of 3.0% annualized in Q4 for its softest since 2Q21 after 3.2% in Q3, 3.8% in Q2 and 3.6% in Q1.
- The wages & salaries component told the same story, easing to 3.0% annualized in Q4 after 3.2% in Q3, with the private sector-only version also at 3.0% after 3.2%.
- These comprehensive wage growth metrics show a more modest backdrop than the average hourly earnings data from the monthly payrolls report, with its 4.0% annualized in Q4 after 3.9% in Q3 in the latest vintage before Wednesday’s update for January. The non-supervisory component, accounting for approximately 80% of employees is a little closer to ECI metrics but still stronger at 3.4% in Q4 after 3.8% in Q3.
- Coupled with still robust productivity growth (4.9% annualized or 1.9% Y/Y in Q3) and nominal wage growth closer to 3% in 2H25 has started to point to disinflationary pressures stemming from the labor market.
- The return to nominal wage growth rates closer to the pre-pandemic period follows quit rates easily falling back into pre-pandemic ranges for some time now.
US TSY FUTURES: BLOCK: Mar'26 10Y Ultra-Bond Buy
- +9,505 UXYH6 114-30, buy through 114-29.5 post time offer at 0844:49ET, DV01 $850,000.
- The 10Y ultra contract trades 114-30 last (+11) vs. -31.5 high