JAPAN DATA: Tokyo August CPI Y/Y In Line, But Services Inflation Edges Up M/M
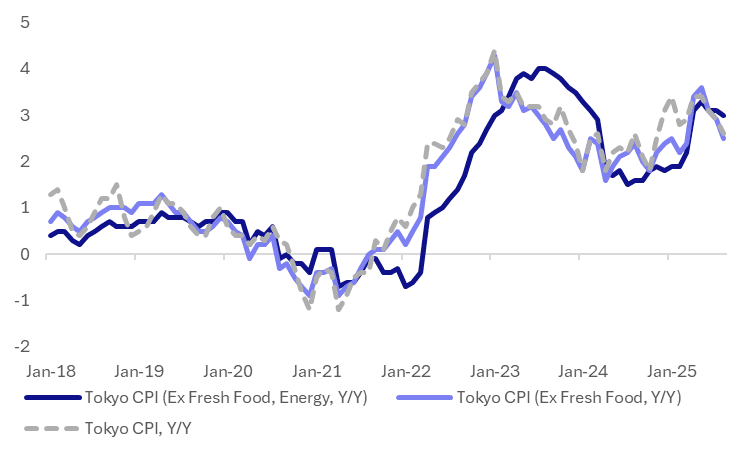
The August Tokyo CPI print was in line with market expectations in terms of the y/y outcomes. The headline rose 2.6%y/y, versus 2.9% prior (2.6% was also the consensus estimate). Ex fresh food CPI was 2.5%y/y (2.9% prior), while the measure excluding fresh food and energy was 3.0%y/y (prior was 3.1%). The chart below plots these inflation trends, with headline lower, but core sticky in terms of ex fresh food, energy.
- In terms of the m/m details, there were slightly stronger themes. In seasonally adjusted terms, we rose 0.1%m/m for the headline while ex fresh food and energy was up 0.2%m/m. Goods prices were flat, but services were up 0.2%.
- In non-seasonally adjusted terms, the ex food, energy index rose 0.4%m/m, the strongest gain since April.
- In terms of the sub categories we saw a sharp fall in utilities of 5.1%m/m. This reflected government utility subsidies. Clothing fell by another 0.6%m/m.
- Other categories were mostly firmly, with entertainment rising 2.2%m/m, which follows a 0.6% rise in July. Food prices were up 0.8%m/m, while fresh food rose 3.2%.
- So outside of the sharp fall in utilities, inflation pressures were mostly firmer in August on a m/m basis.
Fig 1: Tokyo CPI Y/Y Trends, Core Still Elevated
Source: Bloomberg Finance L.P./MNI
Want to read more?
Find more articles and bullets on these widgets:
Historical bullets
ASIA STOCKS: South Korea Inflows Strong, Taiwan Sees July Inflows Pared
South Korea saw continued positive inflow momentum yesterday. This brings inflows for the last 5 days up close to $1.9bn. July to date inflows now stand at +$3.8bn. The Kopsi is attempting to maintain its breach above the 3200 level as we approach month end. Samsung Electronics also closed at a fresh high yesterday, back to September last year.
- Taiwan inflow momentum abruptly stalled yesterday, with nearly $600mn in offshore selling. This was the largest daily outflow since June 19. Month to date inflows for Taiwan still stand at +$7.24bn, so we may be seeing some paring of risk ahead of key event risks and month end. Yesterday the Taiex fell by 0.9%.
- Elsewhere, India outflow momentum continued, bringing July outflows to date of just over $1.7bn.
- Thailand inflows were the main standout in South East Asia (SEA). A modest outflow on Monday proved to be short lived, with sentiment likely aided by the Thailand-Cambodia ceasefire. The SET finished yesterday's session +1.3% higher, putting the index above 1233, which is fresh highs since Feb of this year.
- Modest outflow trends continued elsewhere in SEA.
Table 1: Asian Markets Net Equity Flows
| Yesterday | Past 5 Trading Days | 2025 To Date | |
| South Korea (USDmn) | 432 | 1894 | -5567 |
| Taiwan (USDmn) | -599 | 586 | 1315 |
| India (USDmn)* | -689 | -931 | -9861 |
| Indonesia (USDmn) | -26 | 15 | -3633 |
| Thailand (USDmn)* | 104 | 285 | -1846 |
| Malaysia (USDmn) | -34 | -62 | -2921 |
| Philippines (USDmn) | -7 | -3 | -626 |
| Total (USDmn) | -819 | 1784 | -23139 |
| * Data Up To July 28 |
Source: Bloomberg Finance L.P./MNI
LNG: European Gas Rallies As Uncertainty Rises On US Russia Threats
European natural gas rose 4% to EUR 34.20 on Tuesday to be up 5.2% this week and 4% this month. It has risen sharply this week following US President Trump’s announcement that Russia now has 10 days to stop hostilities in Ukraine. A failure to do so, which is clearly possible, would result in high tariffs including against those who buy its fossil fuels, which would have significant implications for global supplies.
- Polymarket reported an increase in the odds of increased US sanctions on Russia by September 15 to 70%. The market reaction to the shift in the deadline for a truce is in line with this data.
- Former Russian President Medvedev said that Trump’s “ultimatums” were a “step towards war”, per Russian state media. The Kremlin was clear that it is going to ignore the deadline.
- Europe has imported more than average LNG recently to refill storage ahead of winter. This has been helped by a mild Asian summer but it is about to turn hotter, which could increase LNG demand for cooling. Parts of Europe are also forecast to see warmer weather in August.
- Inspired Plc observes that the US-EU trade deal is unlikely to drive significantly higher EU LNG imports from the US, as already around 80% of US LNG exports go to the EU (Bloomberg).
- US gas rose 3.2% to $3.165 to be up 0.2% this week but still down 9.3% in July. Buyers took advantage of the recent drop in prices driven by forecasts for a mild start to August and ample supply. It is down 13.5% from the 18 July high of $3.657.
JGBS: Futures Higher Overnight With US Tsys, BoJ Policy Decision Tomorrow
In post-Tokyo trade, JGB futures closed stronger, +14 compared to settlement levels, after US tsy bulls ran with supportive data, solid auction results, and technical factors to post strong gains on the day.
- The combination of weaker-than-expected JOLTS, cooler inflation, and a good 7-year auction added to already growing bullish momentum.
- The 7Y note auction stopped through at 4.092% high yield vs. WI of 4.120%; bid-to-cover 2.79x from 2.46x prior.
- Focus now turns to today’s FOMC policy decision.
- MNI JAPAN: LDP Confirms General Assembly That Could Decide PM Ishiba's Fate. The governing Liberal Democratic Party (LDP) confirmed on 29 July that its executive committee will call a General Assembly of LDP members of the National Diet 'in the near future'. This could prove pivotal for the tenure of PM Shigeru Ishiba following the disastrous performance of the LDP in the 20 July House of Councillors election.
- Today, the local calendar will be empty ahead of the BoJ Policy Decision tomorrow.