FOREX: Tech Focus: USD Index at Key Inflection Point
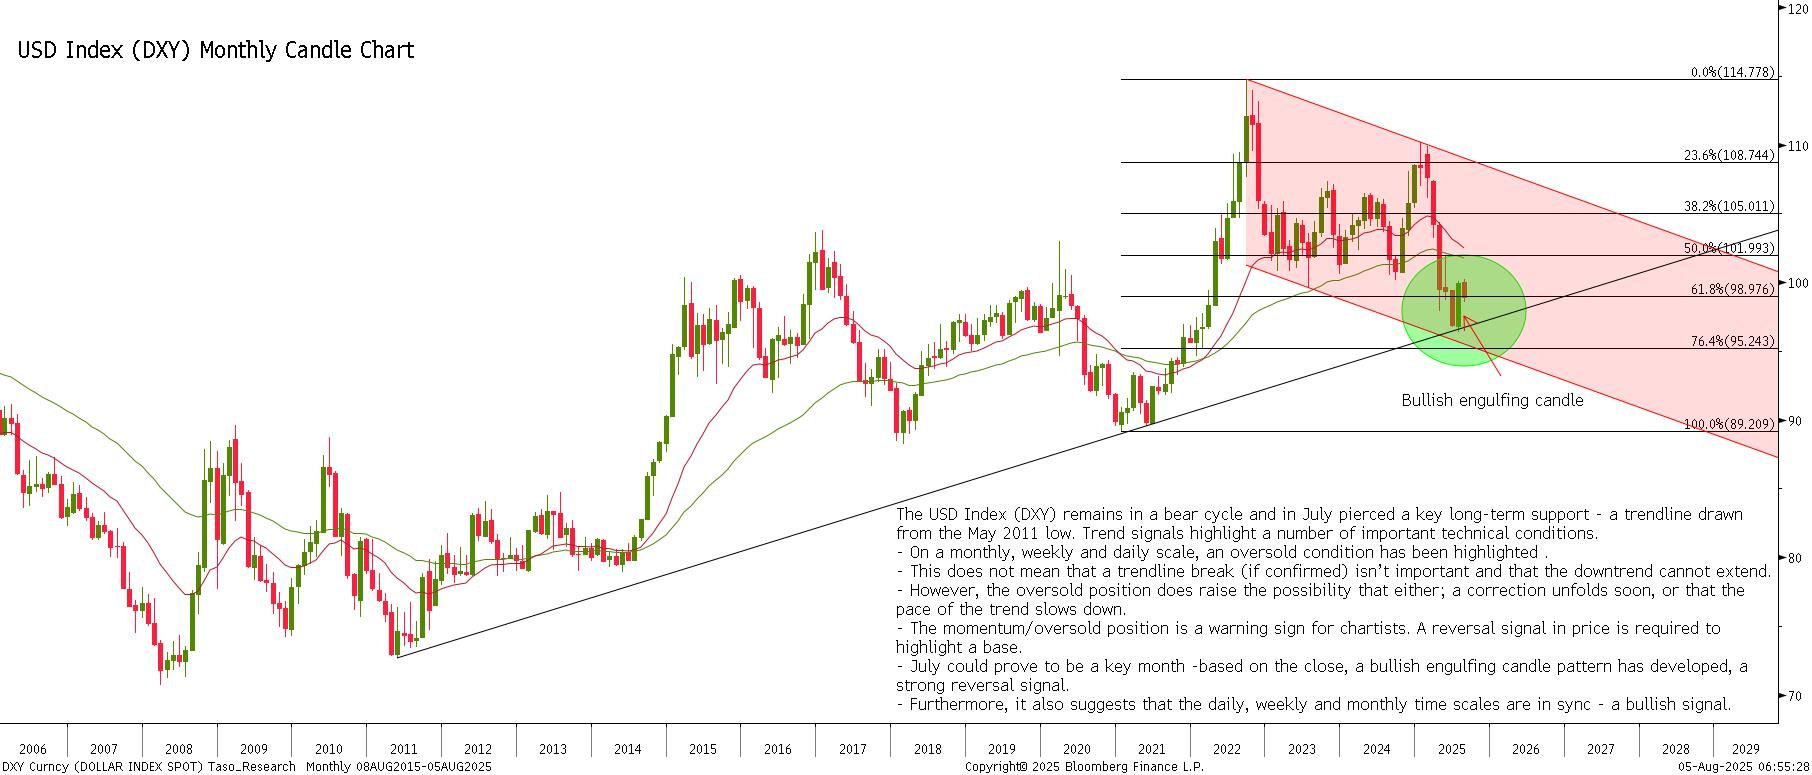
The USD Index remains in a bear cycle and in July pierced a key long-term support at 96.55 - a trendline drawn from the May 2011 low. Trend signals highlight a number of important technical conditions.
- On a monthly, weekly and daily scale, an oversold condition has been highlighted .
- This does not mean that a trendline break (if confirmed) isn’t important and that the downtrend cannot extend.
- However, the oversold position does raise the possibility that either; a correction unfolds soon, or that the pace of the trend slows down.
- As is always the case in such situations, the momentum/oversold position is merely a warning sign for chartists. A reversal signal in price is required to highlight a base.
- July could prove to be a key month. Based on the close, a bullish engulfing candle pattern has developed.
- This is regarded as a strong reversal signal and the fact that it has occurred at the trendline, strengthens the importance of the pattern.
- Furthermore, it also suggests that the daily, weekly and monthly time scales are in sync - a bullish signal.
- Key support is at the July low of 96.38 and this price point represents an important pivot point.
Want to read more?
Find more articles and bullets on these widgets:
Historical bullets
USDCAD TECHS: Trend Outlook Remains Bearish
- RES 4: 1.4111 High Apr 4
- RES 3: 1.4016 High May 12 and 13 and a key resistance
- RES 2: 1.3920 High May 21
- RES 1: 1.3674/3776 20- and 50-day EMA values
- PRICE: 1.3607 @ 16:12 BST Jul 4
- SUP 1: 1.3557 Low Jul 03
- SUP 2: 1.3540 Low Jun 16 and the bear trigger
- SUP 3: 1.3503 1.618 proj of the Feb 3 - 14 - Mar 4 price swing
- SUP 4: 1.3473 Low Oct 2 2024
The trend needle in USDCAD points south and this week’s move down reinforces current conditions. S/T gains between Jun 16 - 23 appear to have been corrective. Key support and the bear trigger is 1.3540, Jun 16 low. Clearance of this level would resume the downtrend and open 1.3503, a Fibonacci projection. Pivot resistance is at the 50-day EMA, at 1.3776. A clear break of this average would signal scope for a stronger recovery.
AUDUSD TECHS: Bull Cycle Remains In Play
- RES 4: 0.6700 76.4% retracement of the Sep 30 ‘24 - Apr 9 bear leg
- RES 3: 0.6688 High Nov 7 ‘24
- RES 2: 0.6603 High Nov 11 ‘24
- RES 1: 0.6590 High Jul 01
- PRICE: 0.6548 @ 16:05 BST Jul 04
- SUP 1: 0.6521 20-day EMA
- SUP 2: 0.6468/6373 50-day EMA / Low Jun 23 and a reversal trigger
- SUP 3: 0.6357 Low May 12
- SUP 4: 0.6275 Low Apr 14
The trend set-up in AUDUSD remains bullish and the pair is holding on to its recent gains. The latest break higher maintains the bullish price sequence of higher highs and higher lows, the definition of an uptrend. Moving average studies are in a bull-mode position, highlighting a dominant uptrend. Sights are on 0.6603 next, the Nov 11 2024 high. Key short-term support has been defined at 0.6373, the Jun 23 low.
EURJPY TECHS: Northbound
- RES 4: 171.88 High Jul 19 ‘24
- RES 3: 171.28 1.382 proj of the Feb 28 - Mar 18 - Apr 7 price swing
- RES 2: 171.09 High Jul 23 ‘24
- RES 1: 170.61 High Jul 03
- PRICE: 170.22 @ 16:04 BST Jul 04
- SUP 1: 169.04 Low Jul 02
- SUP 2: 167.87 20-day EMA
- SUP 3: 167.13 Low Jun 20
- SUP 4: 165.66 50-day EMA
EURJPY traded higher on Thursday resulting in a print above 170.47, the 76.4% retracement of the Jul 11 - Aug 5 sell-off. A clear break of this price point would strengthen bullish conditions and signal scope for extension. This would open 170.28 next, a Fibonacci projection. The trend is overbought, a pullback would unwind this condition. Support to watch lies at 167.87, the 20-day EMA.