ASIA STOCKS: Taiwan Inflows For The Week Close To The Strongest For 2025
Strong inflow momentum continued into Taiwan yesterday. The nearly $1.2bn in net inflows bought the past 5 trading sum to just short of $6bn. Since this Monday we have seen near $4.7bn in net inflows, which is back close to the strongest week of net inflows seen in 2025. Late June saw a weekly inflow of just over $4.8bn. Taiwan equities were steadier yesterday, but Thursday US trade saw continued rises in indices like the SOX (now up for six straight sessions). Fed easing expectations and broader optimism around the AI/chip related outlook continue to drive positive sentiment in this space
- South Korean equity inflows remained positive, albeit at a slightly reduced pace compared to earlier in the week. Again, South Korean equity market remains quite positive, with the Kospi continuing to rally. We aren't too far away from the 3400 level. Whilst there is some uncertainty around taxes on capital gains, President Lee left a firm impression yesterday that the government still sees upside in local stocks.
- Elsewhere, Wednesday saw a strong inflows day into Indian stocks, but this only modestly pares year to date outflows.
- Indonesia recorded further outflows yesterday, but the pace of outflows has slowed from earlier in the week (when the new FinMin was first announced).
- Thailand inflows rose, but the past 5 days has still seen a small net outflow.
Table 1: Asian Markets Net Equity Flows
| Yesterday | Past 5 Trading Days | 2025 To Date | |
| South Korea (USDmn) | 168 | 1802 | -3464 |
| Taiwan (USDmn) | 1193 | 5907 | 6494 |
| India (USDmn)* | 510 | 555 | -15138 |
| Indonesia (USDmn) | -12 | -399 | -3726 |
| Thailand (USDmn) | 47 | -11 | -2528 |
| Malaysia (USDmn) | 25 | -2 | -3808 |
| Philippines (USDmn) | 3 | -6 | -732 |
| Total (USDmn) | 1934 | 7847 | -22901 |
| * Data Up To Sep 10 |
Source: Bloomberg Finance L.P.?MNI
Want to read more?
Find more articles and bullets on these widgets:
Historical bullets
US STOCKS: S&P Explodes To Make New All-Time Highs
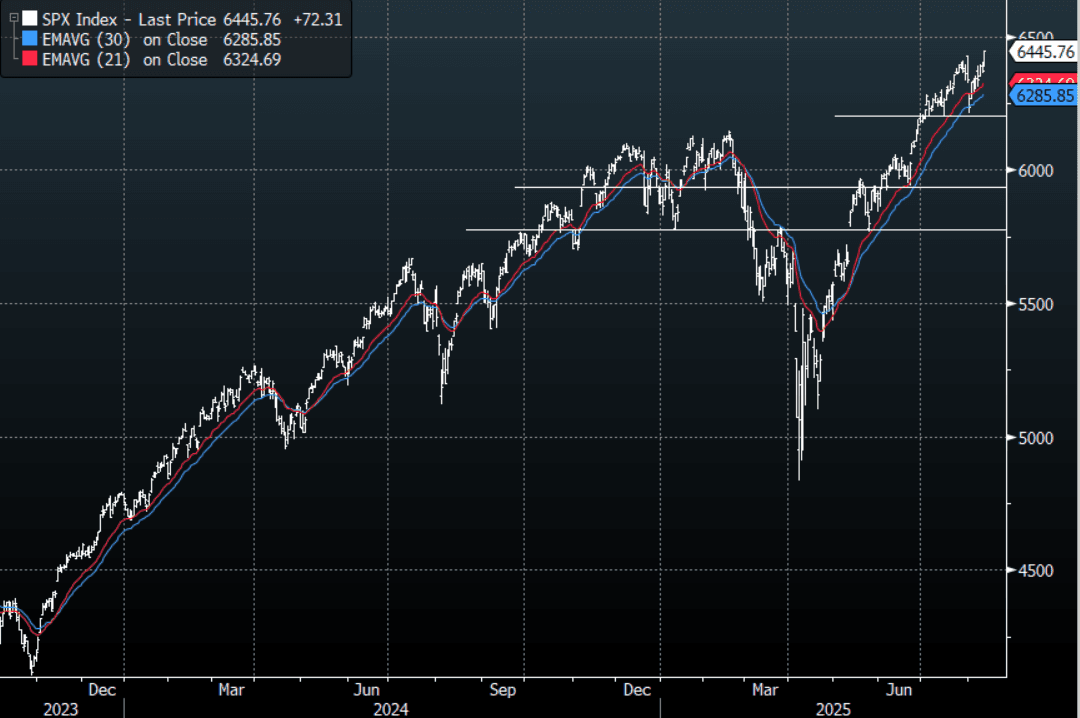
The ESU5 overnight range was 6391.25 - 6474.75, Asia is currently trading around 6466. The ESU5 contract stormed to new all-time highs in the N/Y session as the market gears up for a potential series of rate cuts. This morning US futures have opened pretty muted though still at their highs, ESU5 -0.02%, NQU5 +0.03%. Only a break below 6200 would potentially signal a deeper correction but for now the price action in stocks continues to be bullish ignoring all headwinds as the Trump Administration runs the economy on hot.
- Ben Hunt on X: “If we’re gonna cut in Sept (90% mkt odds as I write this) with core at 3.1% and rising, wages at 3.9% and rising, stocks and home prices at all-time highs … Can we at least stop talking about the Fed’s 2% inflation ‘target’? It’s just insulting to continue this charade.”
- Charlie Bilello on X: “1. Stocks: all-time high 2. Home Prices: all-time high 3. Bitcoin: all-time high 4. Gold: all-time high 5. Money Supply: all-time high 6. National Debt: all-time high 7. CPI Inflation: 4% per year since Jan 2020, 2x the Fed's "target" 8. Fed: cutting interest rates next month.”
- Daily Chartbook on X: "Over July 22nd - August 5th, Hedge Fund short sold $4.3bn - the largest 2 week amount for at least the past 10 years. The resultant level of outstanding shorts in notional terms also marked a new high. -GS Quinn.”
Fig 1: SPX Daily Chart

Source: MNI - Market News/Bloomberg Finance L.P
JAPAN DATA: Import Prices Up For First Month Since Jan, Y/Y Still Negative
For July, export and import prices both rose in m/m terms. Export prices were up 1.6%, while import prices were up 2.4%m/m. For import prices this was the first m/m rise since January of this year. In y/y terms, both export and import prices were still in negative territory, but up from the June levels. Export prices were -5.4%y/y, while imports were -10.4%.
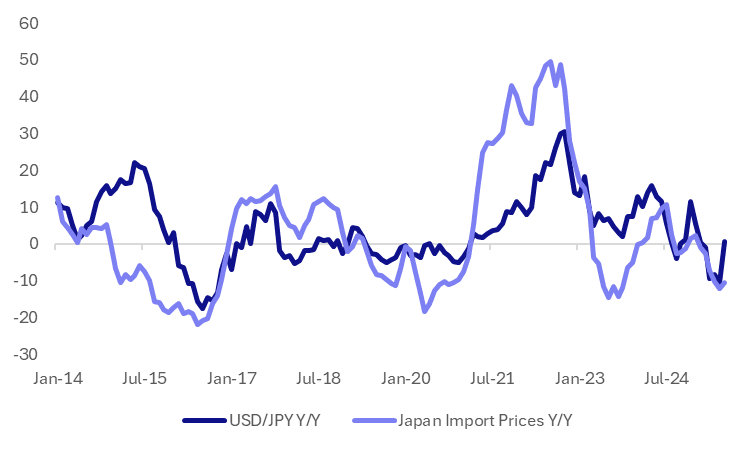
- The chart below plots y/y changes in USD/JPY versus import prices y/y. To end July USD/JPY was up a touch in y/y terms. If current spot levels prevail, (currently around 147.80), USD/JPY will remain positive in y/y terms to end September (note USD/JPY was 152.03 end Oct last year).
- This implies some upside to import price y/y momentum in the near term, albeit fairly modestly. If USD/JPY holds around current level to end September, we would be up +2.9% in y/y terms.
Fig 1: Japan Import Prices & USD/JPY, Y/Y

Source: Bloomberg Finance L.P./MNI
AUSSIE BONDS: Dec-35 Supply Faces Lower Yield But Same Curve
The Australian Office of Financial Management (AOFM) will today sell A$1200mn of the 4.25% 21 December 2035 bond. The line was last sold on 9 July 2025 for A$1200mn. Bidding is likely to be shaped by several key factors:
- The current outright yield is 5-10bps lower than the previous auction and approximately 50bps lower than the peak in late 2024.
- The 3/10 yield curve is around the same level as the previous auction but sits around 20bps below its recent high.
- On the negative side, the auction comes amid weaker sentiment toward longer-dated global bonds.
- However, the line is included in the XM basket.
- While some factors may limit the overall strength of bidding, there is an expectation of continued firm pricing at today's auction.
- Results are due at 0200 BST / 1100 AEST.