NEW ZEALAND: Significantly Weaker Jobs Data Could Increase Easing Expectations
Q3 jobs and wages data are released Wednesday and with spare capacity an important driver of monetary easing, will be monitored closely as there has been excess supply in the labour market. Monthly data in the quarter signal there was a stabilization but employment is likely to have remained soft. The unemployment rate is expected to rise 0.1pp to 5.3%, in line with the RBNZ’s August projections. A 25bp cut on 26 November is generally expected but if the labour data print significantly weaker, then expectations of 50bp may increase.
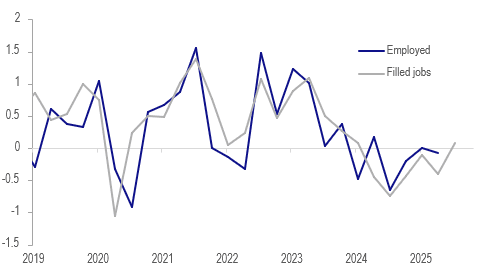
- Q3 filled jobs, vacancy and survey data all point to a stabilisation in NZ’s labour market. Average filled jobs rose 0.1% q/q after falling 0.4% in Q2.
NZ filled jobs vs employment q/q%
Source: MNI - Market News/Statistics NZ/LSEG
- In its August projections, the RBNZ forecast flat Q3 employment growth leaving the annual rate down 0.3%. It also expected private wage growth to moderate to 0.4% q/q from Q2’s 0.6%.
- Bloomberg consensus is forecasting employment to rise only 0.1% q/q and still be down 0.2% y/y with expectations in a fairly narrow range of -0.1% to +0.3% q/q. ASB, Kiwibank and Westpac are below consensus but in line with the RBNZ projecting flat jobs growth in Q3, while BNZ is at +0.1% q/q and ANZ +0.2% q/q.
- Forecasts for the unemployment rate are between 5.2% and 5.4% with ANZ, BNZ, Kiwibank and Westpac all expecting 5.3% but ASB is steady at 5.2%.
- Soft labour demand is likely weighing on private wage growth which is forecast to rise around 0.4% q/q after 0.6%. ASB, BNZ and Kiwibank are all in line with consensus, while ANZ and Westpac expect 0.5%.
Want to read more?
Find more articles and bullets on these widgets:
Historical bullets
USDCAD TECHS: Fresh Cycle High
- RES 4: 1.4111 High Apr 10
- RES 3: 1.4045 3.0% Upper Bollinger Band
- RES 2: 1.4019 38.2% retracement of the Feb 3 - Jun 16 bear leg
- RES 1: 1.3989 200-dma
- PRICE: 1.3953 @ 16:02 BST Oct 3
- SUP 1: 1.3897/3825 Low Sep 30 / 50-day EMA
- SUP 2: 1.3727 Low Aug 29 and a bear trigger
- SUP 3: 1.3689 Low Jul 28
- SUP 4: 1.3637 Low Jul 25
A bull cycle in USDCAD remains intact and yesterday’s break above the late September’s high, firms the bullish theme. This move higher also maintains the bullish price sequence of higher highs and higher lows. Note too that moving average studies are in a bull-mode position, highlighting a dominant uptrend. Sights are on 1.4019, a Fibonacci retracement point. On the downside, first key support lies at 1.3825, the 50-day EMA.
AUDUSD TECHS: Support Remains Intact For Now
- RES 4: 0.6763 1.382 proj of the Jun 23 - Jul 24 - Aug 21 price swing
- RES 3: 0.6726 1.236 proj of the Jun 23 - Jul 24 - Aug 21 price swing
- RES 2: 0.6660/6707 High Sep 18 / 17 and key resistance
- RES 1: 0.6629 High Sep 30 & Oct 01
- PRICE: 0.6603 @ 16:01 BST Oct 3
- SUP 1: 0.6527/21 61.8% of the Aug 21 - Sep 17 bull leg / Low Sep 26
- SUP 2: 0.6484 76.4% retracement of the Aug 21 - Sep 17 bull leg
- SUP 3: 0.6463/6415 Low Aug 27 / Low Aug 21 / 22 and a bear trigger
- SUP 4: 0.6373 Low Jun 23
The AUDUSD uptrend remains intact and recent weakness appears to have been a correction. Support to watch lies at the 50-day EMA, at 0.6558. A clear break of this average would signal scope for a deeper retracement and expose 0.6527 once again, a Fibonacci retracement. For bulls, a stronger reversal higher would refocus attention on 0.6707, the Sep 17 high. Initial resistance to watch is 0.6629, the Sep 30 and Oct 1 high.
US TSYS/SUPPLY: September's Coupon Auctions Were Generally Solid (2/2)
September’s coupon auctions were generally solid, with three lines trading through, two coming out on the screws and two tailing slightly.
- Looking through the lens of MNI’s Relative Strength Indicator (RSI), five lines saw positive readings while two saw negative readings.
- The 3-year sale was the strongest auction of the month according to MNI’s RSI. The 3-year line traded through 0.7bps, the largest stop through in seven months. Meanwhile, the primary dealer take-up was just 8.4%, the lowest on record (data going back to 2003).
- The weakest sale of the month was the last – the 7-year line. This line saw the second consecutive 0.5bp tail, with the 12.0% primary dealer take-up above August’s 9.8% and July’s record low 4.1%.
September Auction Review:
- 2Y Note on-the-screws: 3.571% vs. 3.571% WI.
- 2Y FRN: 0.200% high margin vs. 0.195% prior
- 3Y Note trade-through: 3.485% vs. 3.492% WI.
- 5Y Note tail: 3.710% vs 3.709% WI.
- 7Y Note tail: 3.953% vs. 3.948% WI.
- 10Y Note trade-through: 4.033% vs. 4.047% WI.
- 10Y TIPS: 1.734% high yield vs. 1.985% prior
- 20Y Bond trade-through: 4.613% vs 4.615% WI.
- 30Y Bond on-the-screws: 4.651% vs. 4.651% WI.
