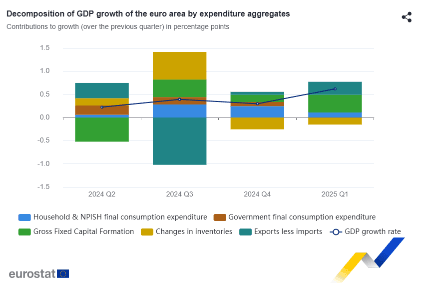
EUROZONE DATA: Q1 GDP Upwardly Revised To Joint Highest Since Q2'22
Eurostat upwardly revised Q1 GDP according to their third estimate of the data, to +0.6% Q/Q (cons 0.4) following 0.3% in the previous estimate and 0.3% in Q4. That is the joint highest sequential pace seen since Q2 2022. On a Y/Y basis, growth was 1.5% (upwardly revised from 1.2%).
- The stronger figures follow ECB President Lagarde saying at yesterday's press conference she would "not be surprised" about an upward revision to Q1 growth.
- Despite the strong performance last quarter, the ECB yesterday saw 2025 overall growth unchanged from their last projection, at 0.9% overall.
Want to read more?
Find more articles and bullets on these widgets:
Historical bullets
FRANCE AUCTION RESULTS: LT OATs
| 3.20% May-35 OAT | 1.25% May-38 OAT | 4.50% Apr-41 OAT | |
| ISIN | FR001400X8V5 | FR0014009O62 | FR0010773192 |
| Amount | E7.768bln | E2.198bln | E2.03bln |
| Previous | E5.93bln | E1.604bln | E677mln |
| Avg yield | 3.24% | 3.51% | 3.62% |
| Previous | 3.37% | 3.33% | 0.38% |
| Bid-to-cover | 2.80x | 3.77x | 2.78x |
| Previous | 3.04x | 4.83x | 2.97x |
| Avg Price | 99.65 | 76.64 | 110.50 |
| Low Price | 99.63 | 76.62 | 110.46 |
| Pre-auction mid | 99.531 | 76.483 | 110.298 |
| Prev avg price | 98.55 | 77.97 | 176.74 |
| Prev low price | 98.52 | 77.95 | |
| Prev mid-price | 98.431 | 77.844 | 176.371 |
| Previous date | 03-Apr-25 | 06-Feb-25 | 02-Dec-21 |
COMMODITIES: Recent Recovery for Gold Could Signal End of Correction Lower
A medium-term bearish trend in WTI futures remains intact and short-term gains are considered corrective. The move down that started Apr 23 signals the end of the correction between Apr 9 - 23. That cycle higher allowed an oversold condition to unwind. Attention is on $54.67, the Apr 9 low and a bear trigger. Clearance of this level would resume the downtrend and open $53.72, a Fibonacci projection. Key resistance to watch is $64.12, the 50-day EMA. Gold has recovered from its recent lows and this suggests the correction between Apr 22 - May 1, is over. A continuation higher would refocus attention on key resistance and the bull trigger at $3500.1, the Apr 22 high. Clearance of this level would confirm a resumption of the primary uptrend. Key short-term support has been defined at $3202.0, the May 1 low. A break of this level is required to signal scope for a deeper retracement.
- WTI Crude up $0.9 or +1.52% at $60
- Natural Gas up $0.11 or +3.06% at $3.569
- Gold spot down $48.86 or -1.42% at $3382.72
- Copper down $4.85 or -1.02% at $473
- Silver down $0.33 or -1.01% at $32.8891
- Platinum down $0.44 or -0.04% at $987.26
EQUITIES: Bullish Conditions in E-Mini S&P Remain Intact
Eurostoxx 50 futures maintain a positive tone and the contract is trading at its recent highs. Price has recently cleared both the 20- and 50-day EMAs, and attention is on 5263.01, 76.4% of the Mar 3 - Apr 7 bear leg. This hurdle has been pierced, a clear break of it would pave the way for a climb towards 5341.00, the Mar 27 high. Initial support to watch lies at 5082.47, the 20-day EMA. Clearance of this level would signal a possible reversal. Bullish conditions in S&P E-Minis remain intact. The contract has breached the 50-day EMA, at 5622.98. A continuation of the bull phase would expose 5837.25 next, the Mar 25 high and a bull trigger. It is still possible that the entire rally since Apr 7 is a correction. A reversal lower would signal the end of this corrective phase and expose initially, support at 5127.25, the Apr 21 low. First support to watch is 5536.59, the 20-day EMA.
- Japan's NIKKEI closed lower by 51.03 pts or -0.14% at 36779.66 and the TOPIX ended 8.38 pts higher or +0.31% at 2696.16.
- Elsewhere, in China the SHANGHAI closed higher by 26.551 pts or +0.8% at 3342.665 and the HANG SENG ended 29.17 pts higher or +0.13% at 22691.88.
- Across Europe, Germany's DAX trades higher by 6.89 pts or +0.03% at 23260.65, FTSE 100 lower by 32.57 pts or -0.38% at 8565.26, CAC 40 down 38.11 pts or -0.5% at 7659.26 and Euro Stoxx 50 down 9.66 pts or -0.18% at 5254.19.
- Dow Jones mini up 212 pts or +0.52% at 41128, S&P 500 mini up 33 pts or +0.59% at 5656.75, NASDAQ mini up 125.75 pts or +0.63% at 19996.25.