OIL: Oil Products Summary At US: Cracks Diverge
Oil Products Summary At US: Cracks Diverge
Cracks were divergent with gasoline cracks supported by a higher than expected stock draw in today’s EIA data release, while diesel cracks faced continued pressure with a higher than expected build in EIA data, somewhat in line with API data yesterday.
• US ULSD crack down 2.3$/bbl at 31.28$/bbl
• US gasoline crack up 0.4$/bbl at 22.54$/bbl
• US 321 crack down 0.5$/bbl at 25.45$/bbl
• EU Gasoil-Brent down 2.2$/bbl at 21.14$/bbl
• EU Gasoline-Brent up 0.3$/bbl at 14.54$/bbl
• EIA data showed gasoline stocks fell more than expected by 2.72mbbl with higher production offset by an increase in both exports and weekly implied demand. The four-week average implied gasoline demand reversed some of the decline seen last week to return to near the previous five-year average.
• EIA data showed distillates stocks rose more than expected by 3.64mbbl despite higher weekly implied demand. The rise was driven by a combination of higher production and imports, and a drop in exports
• Total oil product stocks in the UAE’s Fujairah Oil Industry Zone fell by 3.48m bbls, or 16.9%, to 17.048m bbls, according to Reuters.
• Owners of three vessels chartered by India's Nayara Energy have asked to end their contracts with the company amid pressure from EU sanctions, according to Reuters sources.
• Three vessels laden with oil products from India’s Nayara Energy have yet to discharge their cargoes, hindered by new EU sanctions, according to Reuters.
• China’s Shandong Yulong Petrochemical has bought its first Canadian crude oil cargoes exported via the Trans Mountain pipeline (TMX) for September and October delivery, trade sources told Reuters, as the new refiner diversifies its supplies.
Want to read more?
Find more articles and bullets on these widgets:
Historical bullets
USDJPY TECHS: Bearish Threat
- RES 4: 150.49 High Apr 2
- RES 3: 149.28 High Apr 3
- RES 2: 148.65 High May 12 and a reversal trigger
- RES 1: 146.19/148.03 High Jun 24 / 23
- PRICE: 144.16 @ 17:02 BST Jun 30
- SUP 1: 143.75 Low Jun 26
- SUP 2: 142.80 Low Jun 13
- SUP 3: 142.12 Low May 27 and a key short-term support
- SUP 4: 141.96 76.4% retracement of the Apr 22 - May 12 upleg
A bear threat in USDJPY remains present. The Jun 23 shooting star candle formation highlights a reversal of the recent recovery and price has traded through the 20- and 50-day EMAs. A clear break of the averages would strengthen a bearish threat and signal scope for an extension towards 142.12, the May 27 low and a key short-term support. On the upside, a move above 148.03, the Jun 23 high, would reinstate a bullish theme.
US TSY OPTIONS: Late Aug'25 & Sep'25 10Y Calls
- +30,000 TYU5 112 calls, 1-04 ref 112-03
- +12,500 TYQ5 113 calls, 21 ref 112-02.5
US DATA: June Chicago Fed Index Points To Weaker Services, But Factory Bounce
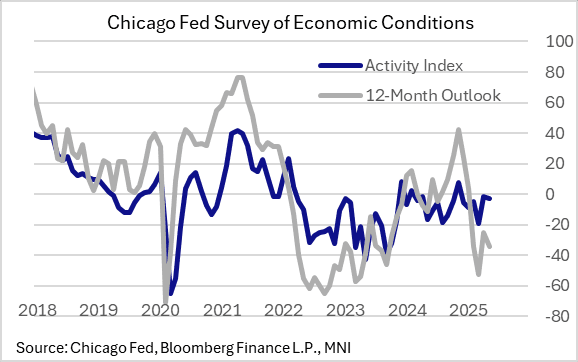
The Chicago Fed Survey of Economic Conditions (CFSEC)' activity index showed a dip in June to -3 from -1 prior, indicating "that economic growth was near trend", per the report.
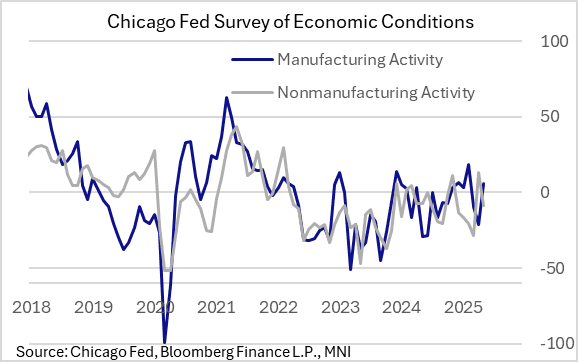
- There was a divergence in sectors: manufacturing activity index rose to +6 vs -21 prior, marking a 3-month high, but nonmanufacturing weakening to a 2-month low -9 vs +13 prior.
- As such, regional nonmanufacturing firms' activity is pulling back to levels seen through most of 2024. Like the MNI Chicago Business Barometer, the CFSEC manufacturing index remains around levels seen through much of 2024-25, though the Chicago Fed's index shows relatively better improvement over the last month. Overall hiring plans, capex and the broader outlook are mired in negative territory.
- The report suggests labor cost pressures are as low as they've been since the start of the recovery from the pandemic bottom, though overall nonlabor price pressures are slightly elevated vs late 2024.
- Other highlights from the report:
- "Respondents’ outlooks for the U.S. economy for the next 12 months deteriorated, and remained pessimistic on balance. Fifty-three percent of respondents expected a decrease in economic activity over the next 12 months. The pace of current hiring decreased, and respondents’ expectations for the pace of hiring over the next 12 months were unchanged. Both hiring indexes remained negative.
- "Respondents’ expectations for the pace of capital spending over the next 12 months increased, but the capital spending expectations index remained negative. The labor cost pressures index decreased, as did the nonlabor cost pressures index. Both cost pressures indexes remained negative."

