NZD: NZD/USD - 0.5640 Caps Pullback, Focus Turns Back To 0.5500
The NZD/USD had a range overnight of 0.5589 - 0.5639, Asia is trading around 0.5585. Strong earnings results from both Nvidia and Walmart, a decent payrolls and yet the relief rally in risk is completely rejected as we end the day back at the lows. This does not have a great smell and we are now sitting on some pivotal levels that if they give way will potentially signal a deeper pullback. The NZD continues to trade heavy with this backdrop having topped out back toward 0.5640 overnight. The next target is the pivotal 0.5500 area which has been very strong support, on the day I suspect while the NZD remains under 0.5630-50 the rallies will be faded as the market turns its focus toward that support.
- Options : Closest significant option expiries for NY cut, based on DTCC data: 0.5480(NZD644m). Upcoming Close Strikes : 0.5670(NZD788m Nov 26), 0.5720(NZD646m Nov 25) - BBG
- The NZD/USD Average True Range for the last 10 Trading days: 47 Points
- Data/Event: Trade Balance
Fig 1: NZD/USD Spot Weekly Chart
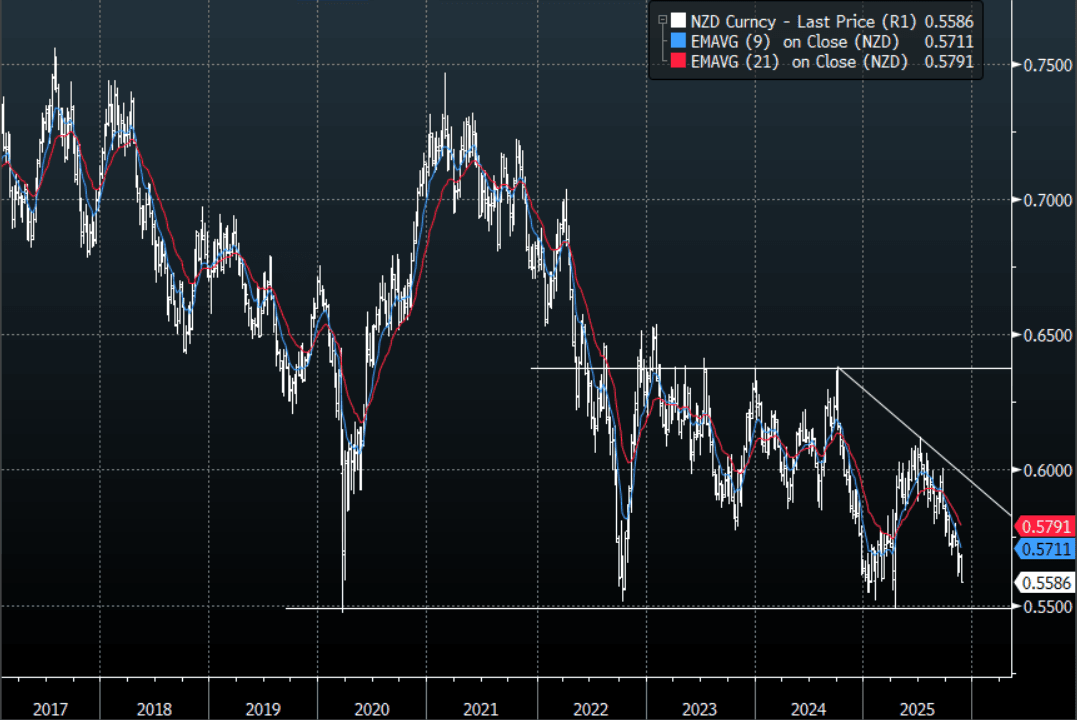
Source: MNI - Market News/Bloomberg Finance L.P
Want to read more?
Find more articles and bullets on these widgets:
Historical bullets
USDCAD TECHS: Bullish Cycle
- RES 4: 1.4200 Round number resistance
- RES 3: 1.4167 50.0% retracement of the Feb 3 - Jun 16 bear leg
- RES 2: 1.4111 High Apr 10
- RES 1: 1.4080 High Oct 16 and the bull trigger
- PRICE: 1.4027 @ 15:46 BST Oct 21
- SUP 1: 1.3972/3895 20- and 50-day EMA values
- SUP 2: 1.3818 Bull channel base drawn from the Jul 23 low
- SUP 3: 1.3727 Low Aug 29 and a bear trigger
- SUP 4: 1.3689 Low Jul 28
The trend condition in USDCAD remains bullish and the pair is trading closer to its recent highs. Moving average studies are in a bull-mode position, highlighting a dominant uptrend. Sights are on 1.4111, the Apr 10 high, and further out, scope is seen for an extension towards 1.4167, a Fibonacci retracement. First key support lies at 1.3895, the 50-day EMA. Support at the 20-day EMA lies at 1.3972.
US TSYS: Tsys Hold Near Highs, New Record High for DJIA, Gold Record Decline
- Treasuries holding narrow, higher range since gaining early Tuesday - apparently sensitive to a couple social media posts by Pres Trump while stocks dipped too after he posted retribution on Hamas if they continue "to act badly, in violation of their agreement with us."
- Second half risk-off coincided with Pres Trump expecting "$20T in US until year end", while Trump anticipates having "a good deal with Xi" the meeting in S Korea at end of the month may NOT happen.
- Currently, the Dec'25 10Y contract trades +5.5 at 113-24.5 vs 113-27.5 high. Moving average studies are in a bull-mode position and this set-up continues to highlight a dominant uptrend. Sights are on 114-10, the Apr 7 high (cont) and the next key resistance. Firm support lies at 113-01+, the 20-day EMA.
- Projected rate cut pricing steady to mildly mixed vs. late Monday levels (*): Oct'25 at -24.2bp (-24.7bp), Dec'25 at -49.2bp (-50bp), Jan'26 at -64.2bp (-63.7bp), Mar'26 at -78.2bp (-77bp).
- Stocks remain mixed late Tuesday, the DJIA outperforming after managing to mark a new record high of 47,125.66 in the first half. Reporting earnings after the close: Netflix, Capital One Financial, Mattel, Western Alliance Bancorp (in the hot seat last week after announcing bad loan losses), Omnicom, EQY and Texas Instruments.
- Precious metals sold off sharply on Tuesday, with spot gold currently down by 5.6% at $4,113/oz and silver down by 7.7% at $48.4/oz, albeit off session lows. Platinum and palladium have also fallen by 5-6%.
AUDUSD TECHS: Candle Pattern Highlights A Potential Reversal
- RES 4: 0.6726 1.236 proj of the Jun 23 - Jul 24 - Aug 21 price swing
- RES 3: 0.6660/6707 High Sep 18 / 17 and a bull trigger
- RES 2: 0.6629 High Sep 30 & Oct 01 and key short-term resistance
- RES 1: 0.6548 50-day EMA
- PRICE: 0.6486 @ 15:45 BST Oct 21
- SUP 1: 0.6440 Low Oct 14
- SUP 2: 0.6415 Low Aug 21 / 22 and a bear trigger
- SUP 3: 0.6373 Low Jun 23
- SUP 4: 0.6357 Low May 12
AUDUSD is in consolidation mode. Price action on Oct 14 continues to highlight a possible reversal pattern - a hammer candle. It signals the end of the bear cycle that started Sep 17. Note that MA studies have remained in a bull-mode position during the latest bear leg, highlighting a dominant M/T uptrend. Initial resistance is 0.6548, the 50-day EMA. A breach of 0.6440, the Oct 14 low, would cancel the reversal signal and reinstate a bear threat.