FRANCE DATA: June IP Surge At Least Partially Due To One-Offs; Weak Outlook
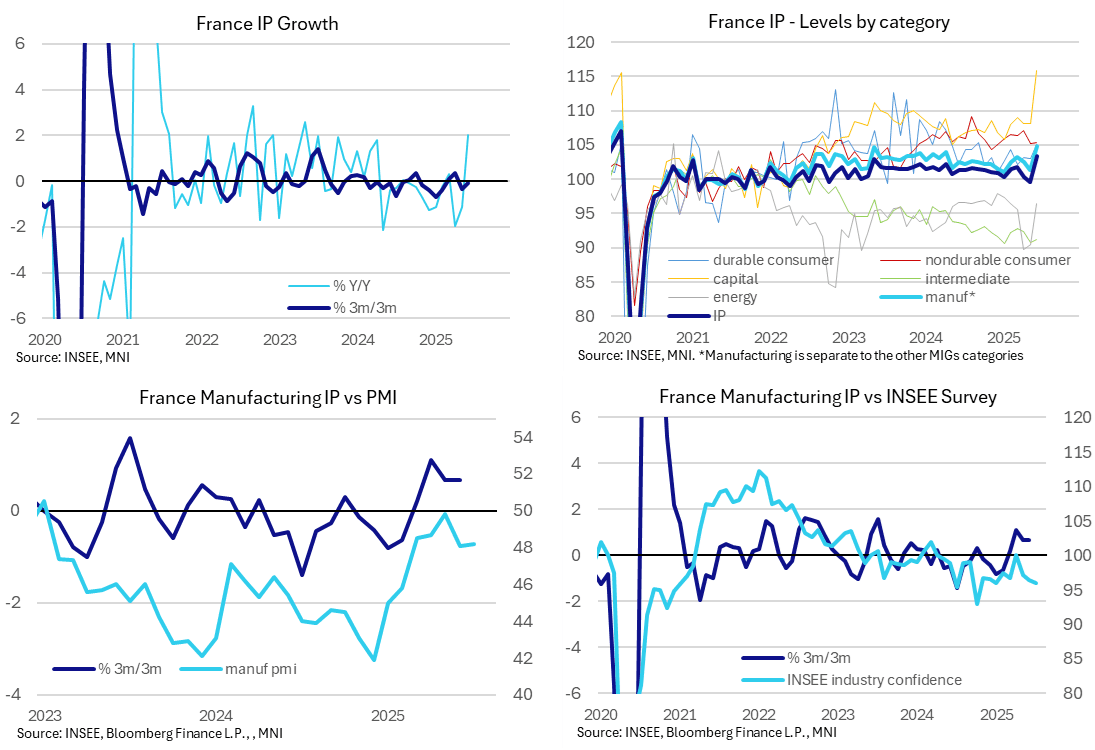
French industrial production was far stronger than expected in June as it surged 3.8% M/M driven in large part but not entirely by catch-up in aeronautical and space construction. Despite that jump, IP fell -0.1% Q/Q in Q2 after 0.1% in Q1 (admittedly with manufacturing at a stronger 0.7% Q/Q) and industrial indicators look soft ahead.
- IP surprisingly surged 3.8% M/M in June (cons 0.6) after -0.7% M/M in May (revised from -0.5%) and a heavy -1.4% M/M in April.
- It came as manufacturing production jumped 3.5% M/M in June (cons 1.2) after -1.2% in May along with a helping hand from the remaining category of "mining & quarrying, energy, water supply and waste management" (about 18% of total IP) rising 5.0% M/M after 1.7% in May.
- Explaining the former the press release added "The exceptional increase in [the transport] sector was mainly driven by the manufacture of "other transport equipment" (aircraft, shipbuilding, rail, etc.) " (+26.7% after +1.8%), and more specifically by aeronautical and space construction. This is explained by a catch-up over the month of delays accumulated over the quarter and the lifting of constraints on supply chains for certain companies in this sector".
- As such, manufacturing of transport surged 16.6% M/M after 0.3% but the separate category of manufacturing of machinery & equipment goods also increased a strong 4.2% M/M after -1.0% so it wasn't in isolation.
- For a slightly broader take, the alternate classification of capital goods production increased 7.2% M/M for its largest monthly increase since July 2020.
- Highlighting the weak backdrop seen in previous months, despite this (presumably largely one-off) strength in June, IP still fell -0.1% Q/Q non-annualised in Q2 after 0.1% in Q1. Manufacturing was at least stronger at 0.7% in Q2 after 0.2% in Q1.
- It clearly sees production heading into Q3 on better momentum, depending on the extent of the payback seen in July, although broader manufacturing prospects don't appear optimistic. The INSEE manufacturing confidence indicator fell for a third consecutive month to 96.0 in July and the manufacturing PMI was roughly unchanged at 48.2. The press release for the latter noted: "the lack of movement in the headline index masked a host of adverse signals seen in the survey's sub-indices. Most notable was a sharp and accelerated drop in new orders".
- A reminder when it comes to French IP however that France has the lowest industry share of GVA amongst the big five Eurozone countries. The 14% in 2024 compared with 23% in Germany (highest) and 19% in Italy (second highest).
Want to read more?
Find more articles and bullets on these widgets:
Historical bullets
USDCAD TECHS: Trend Outlook Remains Bearish
- RES 4: 1.4111 High Apr 4
- RES 3: 1.4016 High May 12 and 13 and a key resistance
- RES 2: 1.3920 High May 21
- RES 1: 1.3674/3776 20- and 50-day EMA values
- PRICE: 1.3607 @ 16:12 BST Jul 4
- SUP 1: 1.3557 Low Jul 03
- SUP 2: 1.3540 Low Jun 16 and the bear trigger
- SUP 3: 1.3503 1.618 proj of the Feb 3 - 14 - Mar 4 price swing
- SUP 4: 1.3473 Low Oct 2 2024
The trend needle in USDCAD points south and this week’s move down reinforces current conditions. S/T gains between Jun 16 - 23 appear to have been corrective. Key support and the bear trigger is 1.3540, Jun 16 low. Clearance of this level would resume the downtrend and open 1.3503, a Fibonacci projection. Pivot resistance is at the 50-day EMA, at 1.3776. A clear break of this average would signal scope for a stronger recovery.
AUDUSD TECHS: Bull Cycle Remains In Play
- RES 4: 0.6700 76.4% retracement of the Sep 30 ‘24 - Apr 9 bear leg
- RES 3: 0.6688 High Nov 7 ‘24
- RES 2: 0.6603 High Nov 11 ‘24
- RES 1: 0.6590 High Jul 01
- PRICE: 0.6548 @ 16:05 BST Jul 04
- SUP 1: 0.6521 20-day EMA
- SUP 2: 0.6468/6373 50-day EMA / Low Jun 23 and a reversal trigger
- SUP 3: 0.6357 Low May 12
- SUP 4: 0.6275 Low Apr 14
The trend set-up in AUDUSD remains bullish and the pair is holding on to its recent gains. The latest break higher maintains the bullish price sequence of higher highs and higher lows, the definition of an uptrend. Moving average studies are in a bull-mode position, highlighting a dominant uptrend. Sights are on 0.6603 next, the Nov 11 2024 high. Key short-term support has been defined at 0.6373, the Jun 23 low.
EURJPY TECHS: Northbound
- RES 4: 171.88 High Jul 19 ‘24
- RES 3: 171.28 1.382 proj of the Feb 28 - Mar 18 - Apr 7 price swing
- RES 2: 171.09 High Jul 23 ‘24
- RES 1: 170.61 High Jul 03
- PRICE: 170.22 @ 16:04 BST Jul 04
- SUP 1: 169.04 Low Jul 02
- SUP 2: 167.87 20-day EMA
- SUP 3: 167.13 Low Jun 20
- SUP 4: 165.66 50-day EMA
EURJPY traded higher on Thursday resulting in a print above 170.47, the 76.4% retracement of the Jul 11 - Aug 5 sell-off. A clear break of this price point would strengthen bullish conditions and signal scope for extension. This would open 170.28 next, a Fibonacci projection. The trend is overbought, a pullback would unwind this condition. Support to watch lies at 167.87, the 20-day EMA.