ASIA STOCKS: Indonesia Enjoys Best 5 Day Run Of Inflows Since Sep 2024
Both Indian and South Korea markets were out on Friday, limiting the equity update for the region. Both markets return today. Elsewhere, Taiwan flows were positive, marginally bringing the 5 day sum of inflows back into positive territory. On Friday, local equities closed just short of recent highs. The authorities also revised higher the 2025 growth forecast to 4.45% from 3.1% (on Friday Q2 preliminary GDP rose 8%y/y, close to the initial estimates). Tech equity sentiment in the US was softer in Friday trade though, with the SOX down over 2%.
- Indonesian positive inflow momentum continued on Friday, bringing inflows last week to just over $400mn. This is the best run for a 5 day period in terms of inflows since late Sep last year. Local equities faltered on Friday, but remain close to recent record highs. The budget deficit projection of 2.48% of GDP for 2026 is slightly tighter than this year's (just beyond 2.5% of GDP), and is likely to be welcomed by the market that was fearful of fiscal slippage under Prabowo's Presidency. Indonesian markets are out today.
- Elsewhere Malaysian outflows continued, with 16 straight sessions of outflows by offshore investors.
Table 1: Asian Markets Net Equity Flows
| Yesterday | Past 5 Trading Days | 2025 To Date | |
| South Korea (USDmn)** | -26 | 510 | -4467 |
| Taiwan (USDmn) | 172 | 90 | 4662 |
| India (USDmn)* | -258 | -977 | -12699 |
| Indonesia (USDmn) | 81 | 412 | -3333 |
| Thailand (USDmn) | -17 | -240 | -1937 |
| Malaysia (USDmn) | -40 | -134 | -3354 |
| Philippines (USDmn) | -9 | 22 | -603 |
| Total (USDmn) | -97 | -317 | -21730 |
| * Data Up To Aug 13 | |||
| ** Data Up To Aug 14 |
Source: Bloomberg Finance L.P./MNI
Want to read more?
Find more articles and bullets on these widgets:
Historical bullets
JGB TECHS: (U5) Returns Toward Lows
- RES 3: 147.74 - High Jan 15 and bull trigger (cont)
- RES 2: 146.53 - High Aug 6
- RES 1: 141.48/142.95 - High May 2 / High Apr 7
- PRICE: 138.08 @ 16:31 GMT Jul 18
- SUP 1: 137.70 - Low Jul 16
- SUP 2: 136.57 - 1.382 proj of the Jan 28 - Feb 20 - Feb 26 bear leg
- SUP 3: 134.89 - 2.000 proj of the Jan 28 - Feb 20 - Feb 26 bear leg
JGBs hold above recent lows, however a bearish theme remains intact following the reversal posted off the mid-June highs. A continuation lower would signal scope for an extension towards 136.57, a Fibonacci projection. On the upside, the first important resistance to watch is 141.48, the May 2 high. A break of this level would be viewed as an early bullish signal.
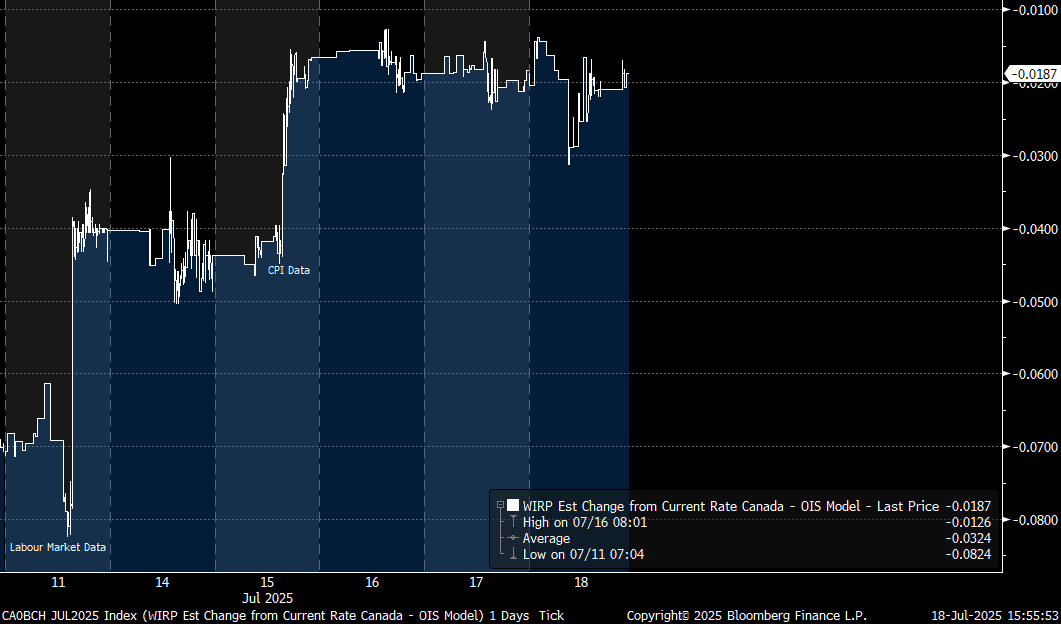
CANADA: July BOC Cut Pricing: From Distinct Possibility To Negligible This Week
The implied probability of a July BOC rate cut has gone from a distinct possibility to negligible this week, following Tuesday's firmer-than-expected core inflation data.
- The accompanying chart shows implied pricing (in percentage points) for July's BOC decision - it dropped from around 30% implied (7+bp) prior to the labour market report last Friday, to under 20% going into CPI (4+bp), reducing after that to under 10% (<2bp).
- For the year as a whole, markets have priced out about 15bp of cuts through those two data points - now seeing about 15bp of easing through December. As such, it's very much in question whether the BOC's easing cycle is already at an end.
- Apart from the ongoing US-Canada trade negotiations, next week's scheduled highlight will be the BOC's Business Outlook Survey out Monday, followed by May Retail Sales out Thursday which will be the final major input into the macro puzzle for the BOC going into its decision on July 30.
| Meeting | Current | Last week's close (Jul 09) | Change since then | Cumulative Change From Current Rate (bp) |
| Jul 30 2025 | 2.74 | 2.68 | 5.6 | -1.9 |
| Sep 17 2025 | 2.69 | 2.60 | 9.3 | -6.0 |
| Oct 29 2025 | 2.65 | 2.53 | 12.1 | -10.5 |
| Dec 10 2025 | 2.61 | 2.45 | 15.7 | -14.6 |
USDCAD TECHS: Has Pierced The 50-Day EMA
- RES 4: 1.3920 High May 21
- RES 3: 1.3862 High May 29
- RES 2: 1.3798 High Jun 23
- RES 1: 1.3747/74 50-day EMA / High Jul 17
- PRICE: 1.3715 @ 16:56 BST Jul 18
- SUP 1: 1.3639/3557 Low Jul 08 / 03
- SUP 2: 1.3540 Low Jun 16 and the bear trigger
- SUP 3: 1.3503 1.618 proj of the Feb 3 - 14 - Mar 4 price swing
- SUP 4: 1.3473 Low Oct 2 2024
USDCAD is trading closer to its recent highs. Attention is on resistance at 1.3747, the 50-day EMA. It has been pierced. A clear break of it is required to highlight a possible stronger short-term reversal. This would open 1.3798, the Jun 23 high. For now, a bear trend remains firmly in place. A resumption of weakness would refocus attention on key support at 1.3540, the Jun 16 low. Clearance of this level would confirm a resumption of the downtrend.