GOLD: Gold Up As Market Fed Cut Pricing Edges Higher
Gold prices rose moderately on Tuesday supported by a modest increase in pricing for a 10 December Fed rate cut and lower 2-year yield as well as a pullback in risk. Also the US dollar finished down slightly. Bullion rose 0.6% to $4067.05 after dipping below $4000 early in the European session.
- USD OIS pricing rose 5pp to a 50% chance of December Fed easing. The policy outlook remains unclear given the delay in data due to the government shutdown. It is beginning to be released now with September payrolls scheduled for Thursday but some October data may never be calculated as surveys were unable to be sent out.
- October 18 jobless claims printed at 232k on Tuesday, in line with the September average. The November NY Fed services index rose to -21.7 from -23.6.
- Gold rose to $4067.05/oz off the high of $4082.29. It fell to $3998.08 earlier, remaining above the 50-day EMA at $3932.1. The move lower over late October appears to have been a correction that unwound the overbought position but the 1.6% rise in November suggests that it is over. Initial resistance is at $4106.7, 17 November high.
- Silver increased 0.9% to $50.686 after reaching $51.181. It fell to $49.363, holding above the 50-day EMA at $47.390.
- Equities sold off with the S&P down 0.8% and Euro stoxx -1.9%. Oil prices were higher though with Brent +0.9% to $64.75/bbl. Copper fell 0.9%.
Want to read more?
Find more articles and bullets on these widgets:
Historical bullets
JGB TECHS: (Z5) Bounce Fades
- RES 3: 140.08 High Jun 13
- RES 2: 139.05 High Aug 4
- RES 1: 137.30 - High Sep 8 and key short-term resistance
- PRICE: 136.22 @ 16:41 BST Oct 17
- SUP 1: 135.61 - Low Oct 08
- SUP 2: 135.39 - 1.618 proj of the Aug 4 - Sep 2 - Sep 8 swing (cont.)
- SUP 3: 134.69 - 2.000 proj of the Aug 4 - Sep 2 - Sep 8 swing (cont.)
Prices surged Monday, in sympathy with global bond markets, helping the price rally toward last week’s high. This rally proved short-lived, however, as domestic fiscal concerns continue to weigh on prices. This affirms the firm downtrend that’s dominated prices since mid-September, and prices will need to challenge resistance before signaling any broader reversal. Key short-term resistance has been defined at 137.30, the Sep 8 high. The latest sell-off, however, resulted in a break of support at 136.19, the Sep 4 low and a bear trigger. Clearance of this level confirms a resumption of the downtrend and opens 135.39 next, a Fibonacci projection.
CHINA: Weekly Preview: Q3 GDP Expected To Slow Ahead of 4th Plenum
Download Weekly Preview Here
- This week could be a pivotal week for policy for the remainder of the year with the loan prime rate decision and GDP third quarter released as Chinese party officials are to meet at the fourth plenum in Beijing. The output will provide guidance for the next 5-years and may be the catalyst for further policy intervention, specifically targeting domestic consumption (which has declined as a percentage of GDP) whilst mindful of the impact of the trade war on manufacturing and exports.
- All major onshore equity bourses remain elevated on a P/E basis, though with falls last week have dipped below the 20-day EMA with Shenzhen near to the 50-day EMA for the first time since June. The Hang Seng by comparison is trade through the 50-day EMA and is near to the 100-day EMA which it last broke below in April.
- The bond market has for best part of this year seen the 10-Yr trading in a +18bps range, with no signs of a breakout. The move above 1.90% in the CGB 10-Yr at the beginning of the month was short lived with it moderating back to 1.82% at the bottom end of recent ranges. Having had a period of relative consistent liquidity injections via the daily OMO, last week saw two significant withdraws late in the week, which may be contributing to the downward move in yields and could be indicative of things to come. Central Government bond issuance this week is focused on the 5-10 Year maturities, with significant size to be issued.
NEW ZEALAND: Q3 CPI Close To Expectations, November Easing Looks Likely
Q3 CPIs are unlikely to derail any further easing at the 26 November RBNZ meeting after the 50bp this month. Headline rose 1% q/q bringing annual inflation to 3.0% y/y from 2.7%, the top of the RBNZ’s target band but there had been fears that it could go above. Domestically-driven non-tradeables were slightly higher than the RBNZ expected at 1.1% q/q but the annual rate at 3.5% was in line. Its measure of core will print today at 1500 NZDT/1300 AEDT.
NZ CPI y/y%
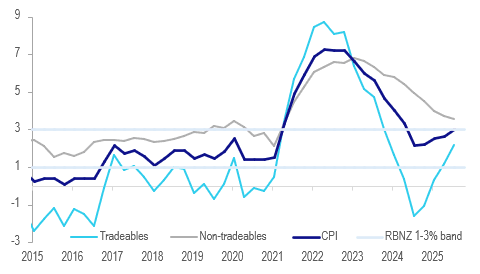
- Core inflation remained well within the band with CPI ex food, energy and vehicle fuel rising 0.8% q/q & 2.5% y/y down from 2.7%.
- The 1% q/q jump in inflation was the largest in two years but is expected to be temporary as it was driven by a 8.8% q/q rise in local authority rates contributing 28% of the quarterly rise, this is measured once a year in Q3, a 12.2% q/q increase in vegetable prices contributed 15% and meat 4% q/q contributed 9.4%. There were offsets from pharmaceuticals (-4.4% q/q) and snacks (-1.8% q/q).
- The important non-tradeables inflation moderated to 3.5% in Q3 from 3.7%, the lowest since Q2 2021 and in line with the RBNZ’s August forecast. Electricity and council rates made the largest contributions while pharmaceuticals and real estate provided a partial offset.
- Tradeables has turned after troughing at -1.6% y/y in Q3 2024 it rose 2.2% y/y in Q3 2025 after Q2’s 1.2%, as the RBNZ expected.
- Goods prices are trending higher rising 2.1% y/y in Q3 after 1.4% while services inflation remains elevated it moderated in Q3 to 4.4% y/y from 4.7% but still higher than Q1’s 4.2%.