JAPAN DATA: Export Growth To Multi Yr Highs, Aided By Tech & Strong China Demand
Japan Jan exports were stronger than forecast, up 16.8%y/y versus 13% expected (5.1% prior). Imports fell -2.5%y/y, against a 3.5% forecast and 5.2% prior outcome. This saw better trade balance outcomes. In unadjusted terms we were -¥1152.6bn, versus -¥2129.1bn forecast, while in seasonally adjusted terms we printed a surplus of ¥455.5bn (-¥162.6bn was the forecast. -¥62.6bn was prior). This is the best trade surplus outcome since early 2021.
- On the export side, this the strongest growth since late 2022. The chart below plots export growth for key Asian economies, with an improving trend late 2025, into early 2026. Taiwan near 70%y/y (the orange line) remains the standout though. Japan is the red line.
- This fits with a generally better than expected global growth backdrop (despite higher tariff levels), along with on-going demand in the chip/tech space.
- Semiconductor exports jumped 39.2% in January after rising 26.6% in December, reflecting continued solid demand for IT-related goods. Automobile exports rose 0.4% in January, the first increase in three months, following a 3.1% decline in December.
- By country, exports to the US fell -5.0%y/y, but this followed a 11.1% fall in Dec. Exports surged to China 32%y/y, with potentially some front loading ahead of the LNY.
- A better external demand demand backdrop should aid broader economic growth conditions, with tariff headwinds proving to be less impactful than feared. Net exports contribution to Q4 GDP growth was flat, while we had a -0.3%ppt drag in Q3 last year.
Fig 1: Key Asian Economy Export Growth Trends - Y/Y
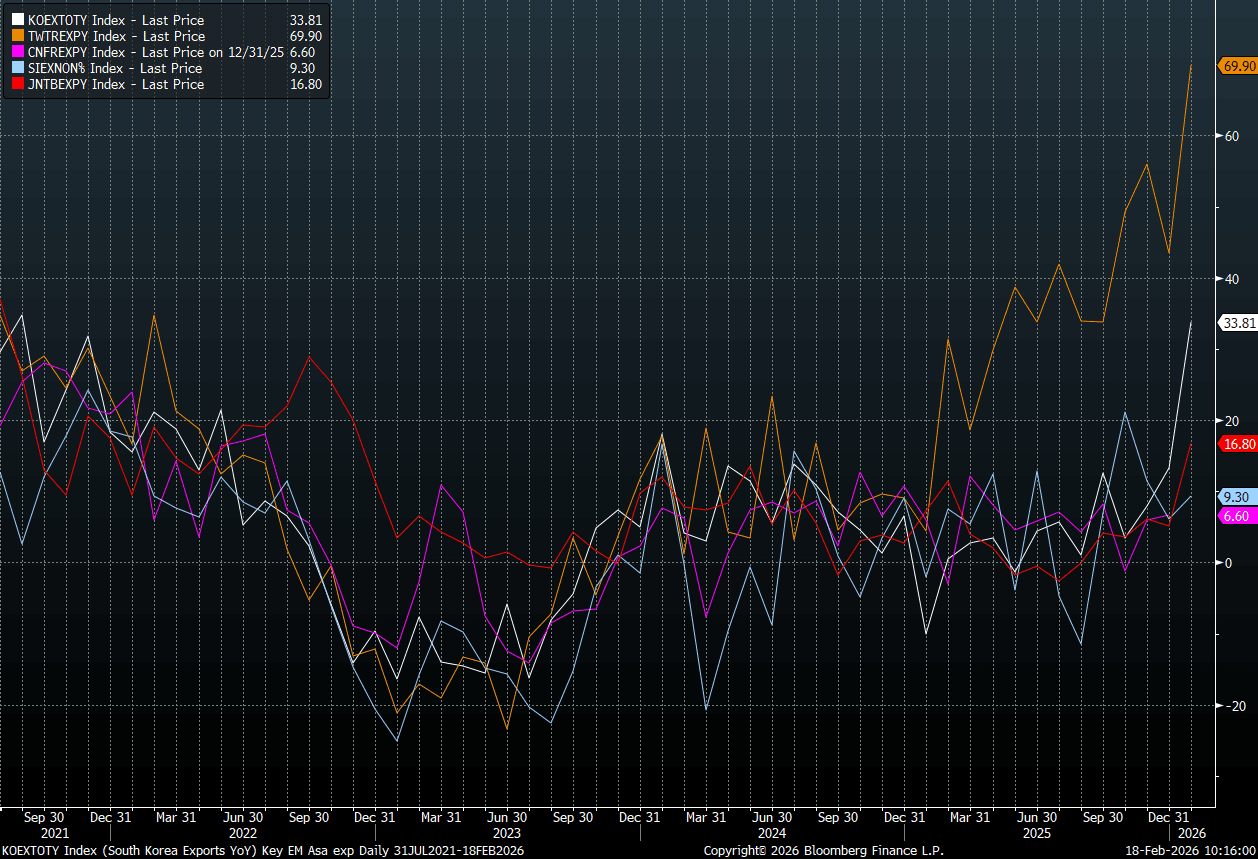
Source: Bloomberg Finance L.P./MNI
Want to read more?
Find more articles and bullets on these widgets:
Historical bullets
US STOCKS: S&P(ESH6) - Gaps Lower On Greenland Tariffs, Testing 6900-6930
The S&P(ESH6) Friday night range was 6960.50 - 7007.00, SPX closed -0.06%, Asia is currently trading around {ESA Index}. The S&P and Nasdaq have both started the week under pressure as the market reacts to Trump’s new Greenland tariffs. This morning futures have gapped lower on this news, E-minis(S&P) -0.65%, NQZ5 -0.90%. On the day in the (ESH6) futures, price has opened lower and is testing the support which lies around 6900-6930, I am always wary of an early Asian Monday morning gap lower as it has a habit of being filled. A sustained break though below 0.6900 could signal the potential for a deeper pullback first target toward 6800-6850.
- Bloomberg - “What Trump Greenland Threat Means for the Economy.” {NSN T92SZNKK3NY8 <GO>}
- Bloomberg - “Investors Didn’t Flee the US in 2025 and they likely won’t in 2026. Thursday’s release of Treasury International Capital, TIC, data showed continued strong demand for US assets in November 2025, with net inflows totalling $221bn. That stands in contrast to narratives around the end of US exceptionalism requiring a meaningful shift away from US markets. Instead, high yields and strong corporate profitability continue to attract capital into both US bonds and equities.”
- The S&P 500 Index Average True Range(ATR) for the last 10 Trading days: 52 Points
Fig 1: S&P 500 Index Daily Chart
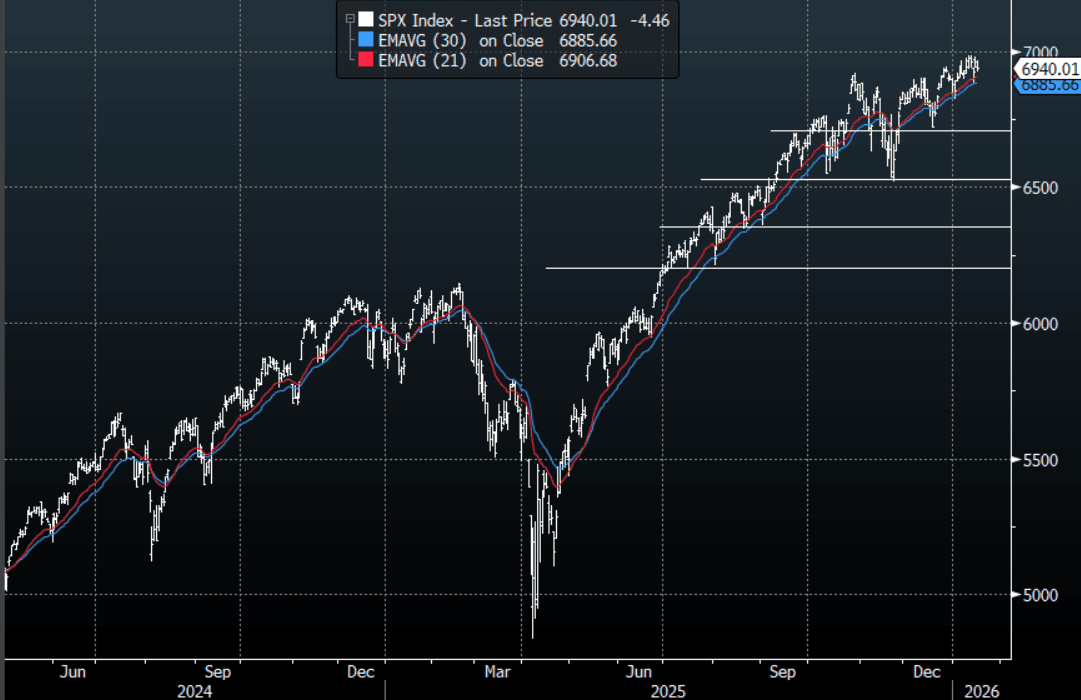
Source: MNI - Market News/Bloomberg Finance L.P
JAPAN DATA: Core Machine Orders Slump, Posing Q4 Capex Risk
Japan core machine orders fell notably more than forecast in Nov. We printed -11%m/m, versus -5.2% forecast and +7.0% prior. This bought the y/y print to -6.4%, versus +4.2% forecast and +12.5% prior. The chart below plots the core machine orders series, y/y, against Japan capex y/y (the orange line on the chart). We don't get Q4 capex spending until Mar 3, although on Feb 16, the preliminary Q4 GDP print is out, which includes business spending. The core machine orders print points to some downside risks to capex/business spending, although we coming off a high base to start Q4. This has been a source of resilient growth for the economy and will be a watch point for the authorities/BOJ, as they have watched for signs of negative spill over from higher US tariffs to the corporate. The outlook is unlikely change off one print though.
- The detail showed fairly soft results, outside of a boost from government orders.
Fig 1: Core Machine Orders Slumped In Nov, Posing Capex Risk
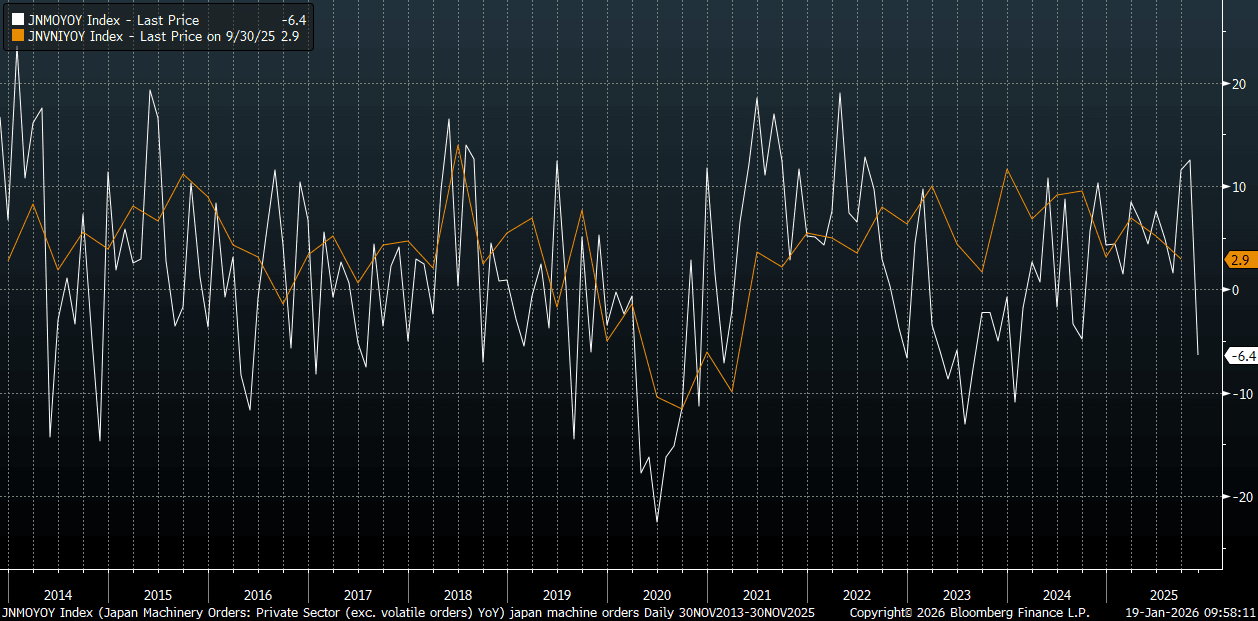
Source: Bloomberg Finance L.P./MNI
PRECIOUS METALS: Greenland Worries Drive Safe-Haven Flows, New Records
Gold and silver have started the week stronger reaching new record highs driven by safe –haven flows on increased geopolitical tensions over US claims on Greenland, a Danish territory. The US has said it will introduce 10% tariffs from February 1 on imports from eight European countries who sent representatives to Greenland, including Germany, the UK and France. They will rise to 25% in June without an agreement to hand the territory over to the US. In addition to Venezuela, Iran and Ukraine, this is making for a very uncertain geopolitical back drop.
- Gold fell to $4536.90 on Friday before recovering to just short of $4600. It reached $4690.59 early in APAC trading and is currently up 1.6% at $4669.0 as risk appetite deteriorates. It breached initial resistance at $4643.0, 14 January high, opening $4696.3, a Fibonacci projection.
- Silver lost 2.5% at the end of last week. It fell to $86.892 but today rallied to $94.121. The metal is currently around $93.55, just below initial resistance at $93.752, 15 January high.
- Europe is not going to retaliate to US tariffs for now but has brought the postponed EUR 93bn package back onto the table that it was proposing if it didn’t reach a trade deal last year. Reuters also mentions that the EU could target US services imports and investments if the Anti-Coercion Instrument is implemented. Further EU meetings to consider its position will take place this week.
- The S&P e-mini is down 0.7% so far today and the ASX -0.2%. The BBDXY USD index is down 0.1%. Copper is up 1.3% but WTI crude -0.6% to $59.00/bbl.