TARIFFS: Europe Large Source Of US Imports But Its Economy Is Less Exposed
A trade deal has been reached between the US and the European Union ahead of this week’s August 1 deadline. The EU was threatened with 30% tariffs but 15% was settled on, in line with Japan, but significantly higher than the current non-agricultural weighted average around 1%. Euro stoxx futures are up 1.0% in APAC trading outperforming the S&P’s +0.4%. EURUSD’s response has been muted.
- The EU is the second largest source of US imports thus a deal was likely but given the significant rise in import duties is also likely to drive higher US prices. The 2024 US deficit with the EU was $235.9bn, but still less than China’s $295.5bn.
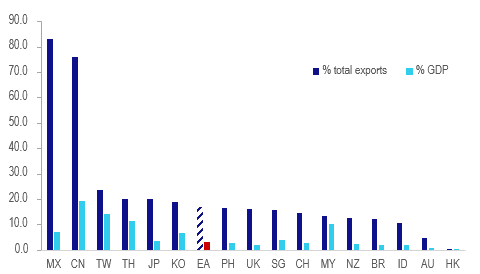
- Exports to the US are important with 16.8% of 2024 extra-euro area goods shipments going there but that was worth only 3.2% of GDP, below the exposure of Canada, Mexico and Taiwan but similar to Japan’s.
Exports to the US (ex NAFTA) 2024 %
- The EU is the second largest source of US auto imports and Germany is fifth. Shipments will also face 15% tariffs but below the 25% duty against all US vehicle imports.
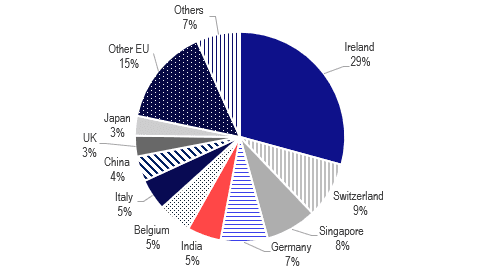
- Pharmaceuticals will also face 15% but it was threatened with up to 200%. 30% of US pharma imports come from Ireland and 57% from the EA accounting for over a quarter of total EA exports to the US.
- The 50% tariff on US imports of steel and aluminium is unchanged but both sides agreed not to tax aircraft and parts.
- Like others, Europe has frontloaded shipments to the US with them peaking at 60.8% y/y in March and easing to 7.3% y/y in May. Bloomberg data showed container ship departures from the EU-6 at around 100/day in the first week of July but that eased to 70 last week well below the pre-2025 average of 95.
US imports of pharmaceuticals & medicines % total 2024
Want to read more?
Find more articles and bullets on these widgets:
Historical bullets
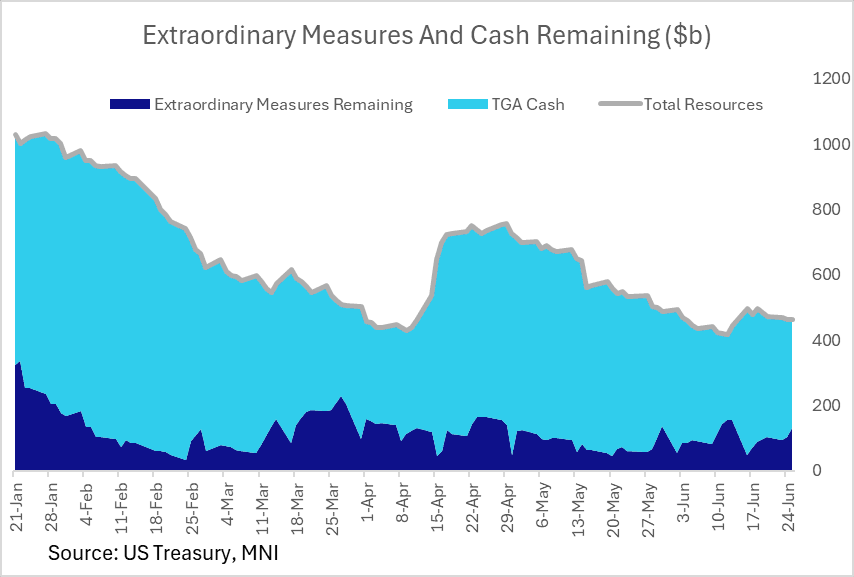
US FISCAL: Available "Extraordinary" Measures To Ward Off X-Date Pick Up
Treasury reported Friday that as of Jun 25 it had $130B in remaining "extraordinary" measures (of a total $378B available) to ward off an "x-date" of running out of resources before defaulting. That's the highest in 2 weeks.
- Combined with $334B cash as of Jun 25 (after a bit of a buildup after the mid-June tax deadline), that's a total of roughly $465B in total resources available.
- We noted earlier this week that Treasury told Congress that it was required to extend its debt issuance suspension period from Jun 27 to Jul 24, in effect prolonging the use of extraordinary measures while we await a resolution to the debt limit impasse, probably through the fiscal legislation currently going through Congress.
- Realistically, fiscal dynamics so far this year point to potential for Treasury to get into September without running out of cash + extraordinary measures. That seems to be the broad market expectation.
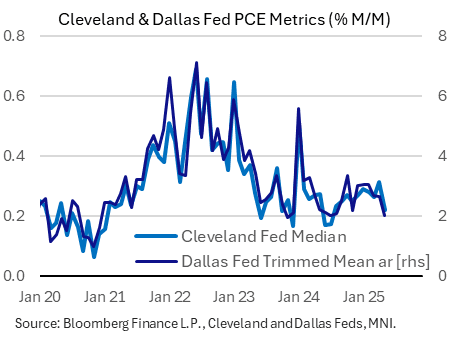
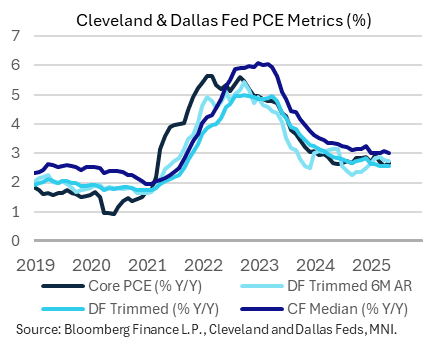
US DATA: Cleveland, Dallas Fed PCE Medians Show Progress But Still Above-Target
The Cleveland and Dallas Fed's median PCE metrics showed a notable drop in May. All indices suggest PCE inflation running above 2%, and higher than the actual core and headline PCE measures, but pressures appear to have cooled from a pickup in the early months of the year.
- The Cleveland Fed's median PCE measure came in at 0.22% M/M, a 10-month low after April's 15-month high 0.31%. This left median PCE at 3.01% on a Y/Y basis, down from 3.06% prior for a the joint-lowest (with Feb) since September 2021.
- The Dallas Fed's annualized median rate fell to 2.01%, from 2.65% prior for a 10-month low. The 6-month annualized rate edged lower to 2.74% (2.76% prior), a 4-month low, with the Y/Y rate ticking down to 2.55% from 2.56%, echoing the Cleveland Fed for the lowest reading since September 2021.
USDCAD TECHS: Pivot Resistance Remains Intact
- RES 4: 1.4111 High Apr 4
- RES 3: 1.4016 High May 12 and 13 and a key resistance
- RES 2: 1.3920 High May 21
- RES 1: 1.2710/3803 20- and 50-day EMA values
- PRICE: 1.3658 @ 16:23 BST Jun 27
- SUP 1: 1.3618 Low Jun 26
- SUP 2: 1.3540 Low Jun 16 and the bear trigger
- SUP 3: 1.3503 1.618 proj of the Feb 3 - 14 - Mar 4 price swing
- SUP 4: 1.3473 Low Oct 2 2024
USDCAD has pulled back from its recent highs. The primary downtrend remains intact and short-term gains appear to have been corrective. Key support and the bear trigger has been defined at 1.3540, the Jun 16 low. Clearance of this price point would resume the downtrend. Any reversal higher would instead signal scope for a stronger retracement. Pivot resistance to monitor is at the 50-day EMA, at 1.3803.