BONDS: EGBs-GILTS CASH CLOSE: Bunds Underperform With ECB Seen Slightly Hawkish
European curves flattened Thursday.
- US CPI data came in on the slightly high side of expectations, but with relatively benign PCE inflation details combined with above-expected jobless claims released simultaneously, global core FI gained ground.
- The main event of the European session was the ECB meeting - MNI's review is here (PDF).
- In short, the bar to cuts was seen to have been raised a little: Lagarde's press conference sparked a hawkish reaction with growth risks deemed more balanced and the disinflationary process over.
- Later in the session, ECB sources from Bloomberg suggested further shocks are needed to see rate cuts. Reuters sources said the debate on a rate cut was not over just yet with October too soon but December eyed.
- On net, the German curve closed with twist flattening on the day as the short-end was notably weaker; Gilts easily outperformed, with bull flattening in the UK curve.
- Periphery/semi-core EGBs tightened amid the weakness in Bunds, with BTPs and OATs outperforming.
- UK activity data features first thing Friday, while multiple ECB speakers make appaearances (Rehn, Nagel, Kocher).
Closing Yields / 10-Yr EGB Spreads To Germany
- Germany: The 2-Yr yield is up 3.4bps at 1.986%, 5-Yr is up 3.2bps at 2.257%, 10-Yr is up 0.5bps at 2.657%, and 30-Yr is down 1.8bps at 3.255%.
- UK: The 2-Yr yield is down 0.9bps at 3.931%, 5-Yr is down 1.2bps at 4.043%, 10-Yr is down 2.7bps at 4.606%, and 30-Yr is down 4.4bps at 5.438%.
- Italian BTP spread down 2bps at 79.5bps / French OAT down 2.1bps at 78.8bps
Want to read more?
Find more articles and bullets on these widgets:
Historical bullets
EURJPY TECHS: Trend Structure Remains Bullish
- RES 4: 177.08 2.000 proj of the Feb 28 - Mar 18 - Apr 7 price swing
- RES 3: 175.43 High Jul 11 ‘24 and a key medium-term resistance
- RES 2: 174.86 1.764 proj of the Feb 28 - Mar 18 - Apr 7 price swing
- RES 1: 173.97 High Jul 28 and the bull trigger
- PRICE: 172.76 @ 16:03 BST Aug 12
- SUP 1: 169.73/45 Low Jul 31 / 23.6% of the Feb 28 - Jul 28 bull leg
- SUP 2: 169.71 50-day EMA
- SUP 3: 168.46 Low Jul 1
- SUP 4: 167.46 Low Jun 23
A bullish trend condition in EURJPY remains intact and for now the recent move down is considered corrective. Key support to watch lies at the 50-day EMA at 169.62. A clear break of the EMA is required to highlight a stronger short-term bearish threat. Moving average studies remain in a bull-mode position highlighting an uptrend. A break of the Jul 28 high of 173.97, would resume the bull cycle.
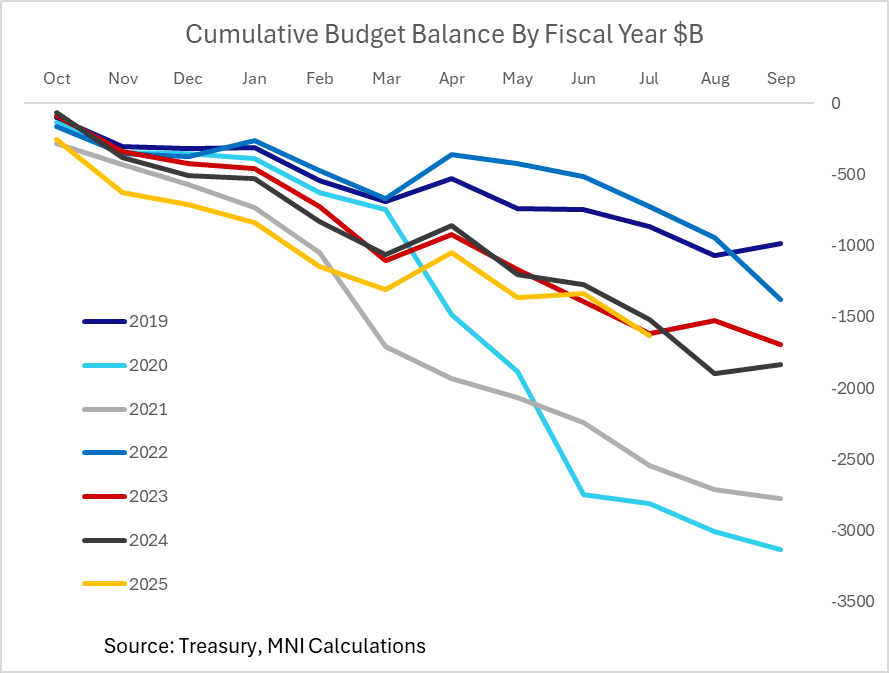
US FISCAL: Federal Deficit Up 7% Y/Y With 2 Months To Go In Fiscal Year
Treasury reported a $291.1B federal budget deficit in July, larger than the $239B shortfall expected by Bloomberg consensus but almost exactly in line with the Congressional Budget Office's previously published $289B estimate.
- As MNI noted previously, while the year-to-date deficit is up 7% Y/Y to $1.629T with two months remaining in the 2025 fiscal year (which runs Oct-Sep), compared with $1.517T in the same period of FY2024, the difference is smaller when adjusting for timing changes.
- CBO estimated a $37B wider deficit when accounting for these changes, vs $109B "actual". The implied adjusted rise in the deficit is around 2% Y/Y, tracking lower than nominal GDP growth over that period.
- YTD revenue is up 6.4% Y/Y ($4.346T), with expenditure up 6.7% ($5.975T).
- At the start of 2025, CBO estimated a $1.9T deficit this fiscal year which remains plausible with August typically seeing a large deficit ahead of a better outturn in September in part on tax receipts, though looks on the high side at this point.
- That implies the FY2025 deficit looks closer to coming in below the 6.4% of GDP posted in FY2024, though is widely expected to re-expand in FY2026 largely on "One Big Beautiful Bill" effects.
- CBO will publish the Monthly Budget Review with its final projection next month.
COMMODITIES: WTI Falls, Gold Steady, Copper Bounces
- WTI has lost ground during US hours to be on track for its lowest close since early June. The EIA’s short-term energy outlook showed an upward revision in the expected supply surplus for 2025.
- The EIA now sees a supply surplus of 1.7m b/d this year, compared to a previous forecast for a 1.1m b/d surplus.
- WTI Sep 25 is down by 1.2% at $63.2/bbl.
- WTI futures remain below the 50-day EMA at $65.15, which keeps short-term momentum pointed lower. The clear break exposes $58.17, the May 30 low.
- Meanwhile, spot gold has edged up by 0.2% to $3,349/oz, with the yellow metal trading in a narrow range as US CPI data came in broadly in line with expectations.
- For now, a bull cycle in gold that started Jun 30 remains intact. Key near-term resistance is $3,439.0, the Jul 23 high.
- However, the yellow metal has previously traded through support at $3,334.0, the 50-day EMA. A clear break of this level would signal scope for a deeper retracement and expose the next key support at $3,248.7, the Jun 30 low.
- Elsewhere, copper has bounced by 1.9% to $452/lb, bringing the red metal to its highest level since July 31.
- However, copper remains well below the Jul 30 high, which cancels the recent bullish theme and instead highlights a bearish threat.
- A continuation lower would signal scope for a test of key support at $411.75, the Apr 7 low. Initial resistance to watch is at $497.25, the Jul 8 low.