EQUITY TECHS: E-MINI S&P: (U5) Trend Needle Points North
Aug-28 13:52
- RES 4: 6600.00 Round number resistance
- RES 3: 6587.42 2.0% 10-dma envelope
- RES 2: 6523.63 1.764 proj of the May 23 - Jun 11 - 23 price swing
- RES 1: 6508.75 High Aug 15 and all-time High
- PRICE: 6500.25 @ 14:41 BST Aug 28
- SUP 1: 6362.75 Low Aug 20
- SUP 2: 6318.96 50-day EMA
- SUP 3: 6313.25 Low Aug 6
- SUP 4: 6239.50 Low Aug 1 and a key support
S&P E-Minis bulls remain in the driver’s seat and the contract is holding on to its recent highs. Moving average studies are in a bull-mode position, highlighting a clear uptrend and positive market sentiment. Attention is on 6508.75, the Aug 15 high. Clearance of this hurdle would confirm a resumption of the uptrend and open 6523.63, a Fibonacci projection. Support to watch lies at 6318.96, the 50-day EMA.
Want to read more?
Find more articles and bullets on these widgets:
Historical bullets
US DATA: Q2 Net Export Tracking Could Be Revised Higher Still [2/2]
Jul-29 13:47
- As for crude volume estimates, previously released export prices (0.5% M/M in June) suggest a weaker month for volumes considering values fell -0.6%.
- Nominal imports weakness looks volumes driven considering prices were near flat at 0.1% M/M after values fell -4.2% M/M.
- We won’t know official volumes data until next week’s final release, however.
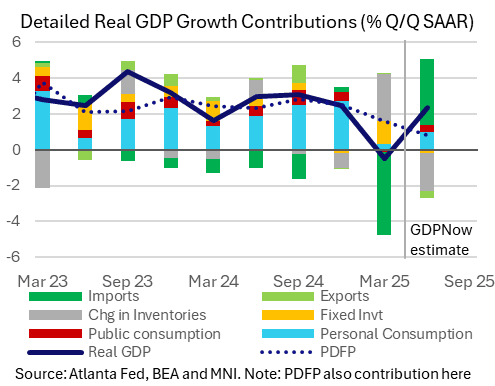
- The Atlanta Fed GDPNow will be updated later today for its final update ahead of Thursday’s advance Q2 release.
- It currently tracks real GDP growth at 2.4% annualized in Q2 after a string of downward revisions from readings firmly within the 3-4% range at the time of the last FOMC meeting in June. It follows -0.5% in Q1 and 2.4% in Q4, essentially implying no “catch-up” from the weak patch of Q1.
- Net exports are seen as a significant upside driver, adding 3.3pps to quarterly growth after a huge -4.6pps in Q1. We suspect this Q2 tracking could be revised higher after today’s June release but will wait and see.
- Today’s GDPNow update will also take into account of latest monthly inventory data. Changes in inventories have been another major source of uncertainty when it comes to GDP forecasting, currently seen by the Atlanta Fed as dragging -2.1pp from GDP growth in Q2 after adding 2.6pp in Q1.
US DATA: Capital Goods Imports Continue Protectionist Boost [1/2]
Jul-29 13:46
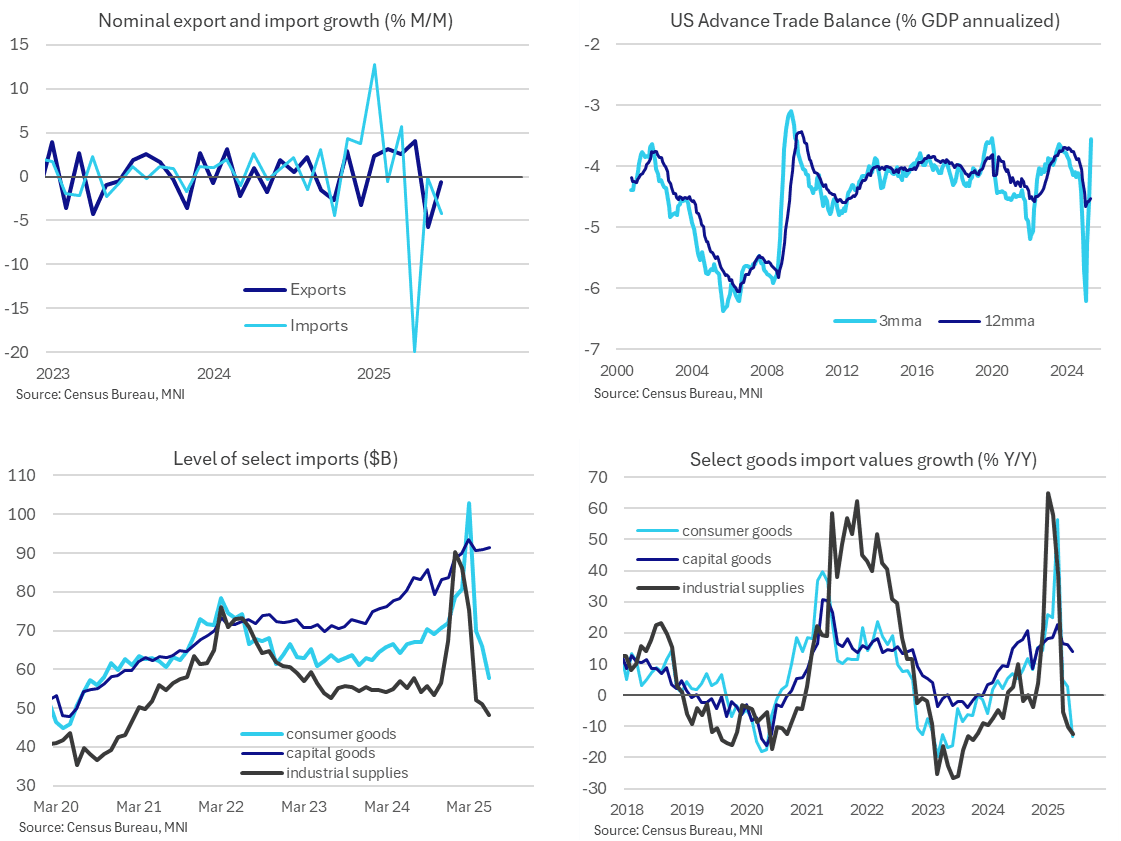
- The goods trade deficit was smaller than expected in June at $86bn (cons $98bn) after $96.6bn in May.
- It appears to be further payback from the huge deficits of Dec and Q1 driven by tariff front-running, primarily gold and then pharmaceutical products.
- It’s useful simply to compare recent levels: the $86bn in June leaves an average of $89bn in Q2 since the actual announcement and then various alterations to reciprocal tariffs, after $155bn in Q1, $109bn in 4Q24 (as it started to show the impact of gold arbitrage) and $102bn in 3Q24.
- That’s a goods deficit worth 3.6% GDP in Q2 after 6.2% in Q1, 4.4% in Q4 and 4.2% in Q3.
- Nominal exports were largely flat in June at -0.6% M/M after swings of -5.7% and +4.1% in the previous two months, with offsetting forces from a bounce in capital goods (+4.7%) and further drop in industrial supplies (-8.1%).
- Imports continued to be the major driver meanwhile, falling a nominal -4.2% M/M in June after -0.1% in May and a historically large -20% M/M in April.
- It left the level of imports of $264bn at the lowest since Mar 2024, below the $272bn averaged in 2024 for example before surging to $333bn in Q1.
- The main culprits for this return to pre-tariff levels are consumer goods ($57.7bn in June vs $67bn in 2024), industrial supplies ($48.3bn vs $56bn) and autos ($36bn vs $39.5bn). One area that bucks this trend, and continues to show signs of impact from more isolationist trade policy, is capital goods imports which rose further to $91.5bn (vs $80bn in 2024).
- A reminder that when discussing this broad categories, industrial supplies includes both monetary gold and petroleum whilst consumer goods include pharmaceutical products.
US TSY FUTURES: BLOCK: Sep'25 5s30s Flattener
Jul-29 13:45
- Curve flattener crossed at 0936:02ET, DV01 $530,000
- -12,388 FVU5 108-07.25 post time bid vs.
- +3,861 USU5 113-22, buy through 113-20 post time offer