INDIA: CPI Preview: New Basket Makes Old Comparisons Difficult
* India's January CPI is out later and is forecast at 2.77%, up from +1.33% in December. Whilst th...
Want to read more?
Find more articles and bullets on these widgets:
Historical bullets
JPY: USD/JPY Breaks Higher, Intervention Threat Returns
The clear break above 158.00 in USD/JPY has seen fresh jawboning emerge from Japan officials, although net market impact remains minimal at this stage. Earlier FinMin Katayama stated concern around one-sided FX moves, which she shared with US Tsy Bessent in recent talks (who also agreed with the FinMins concern) . The Deputy Chief Cabinet Secretary Ozaki has reiterated concern this around one-sided, sharp FX moves and stated the government is ready to take steps to tackle excess volatility, including speculative moves. Broadly the market, for now at least, is taking these comments in its stride, and appears comfortable to continue to test the authorities resolve. We were last at fresh highs of 158.65/70. Below is a series of charts that we monitor, they arguably show intervention risks are heightened, but no more so than they were in late 2025.
- USD/JPY spot remains comfortably above our simple fair value estimate (see top left hand panel), which is written off US-JP 2y swap spreads and global equities. The differential between the two is back around 4% amidst a resilient global equity backdrop (fair value around 152.4). The wedge did close close to 6% in Nov last year.
- The 1month and 3 months rate of change are trending back up, but also remain sub late 2025 highs, top right hand panel chart.
- Market positioning shows leveraged contracts short, per CFTC, but asset managers still long, see the bottom left hand panel chart. The authorities will tend to focus more on speculative positioning (proxied by leveraged contracts), but aggregate positioning (leveraged + asset manager) is not as short as it was in 2022 or 2024 (close to -150k in 2022, -200k at its trough point in 2024, current is around -20k).
- The bottom right hand panel is the 1 month risk reversal and 1 month implied vol. Risk reversals are sub late 2025 highs, while implied vols are painting a fairly benign backdrop, which fits with a still supportive carry back drop for USD/JPY from a broader risk standpoint.
Fig 1: USD/JPY - Various Metrics Compared To Prior Intervention Episodes
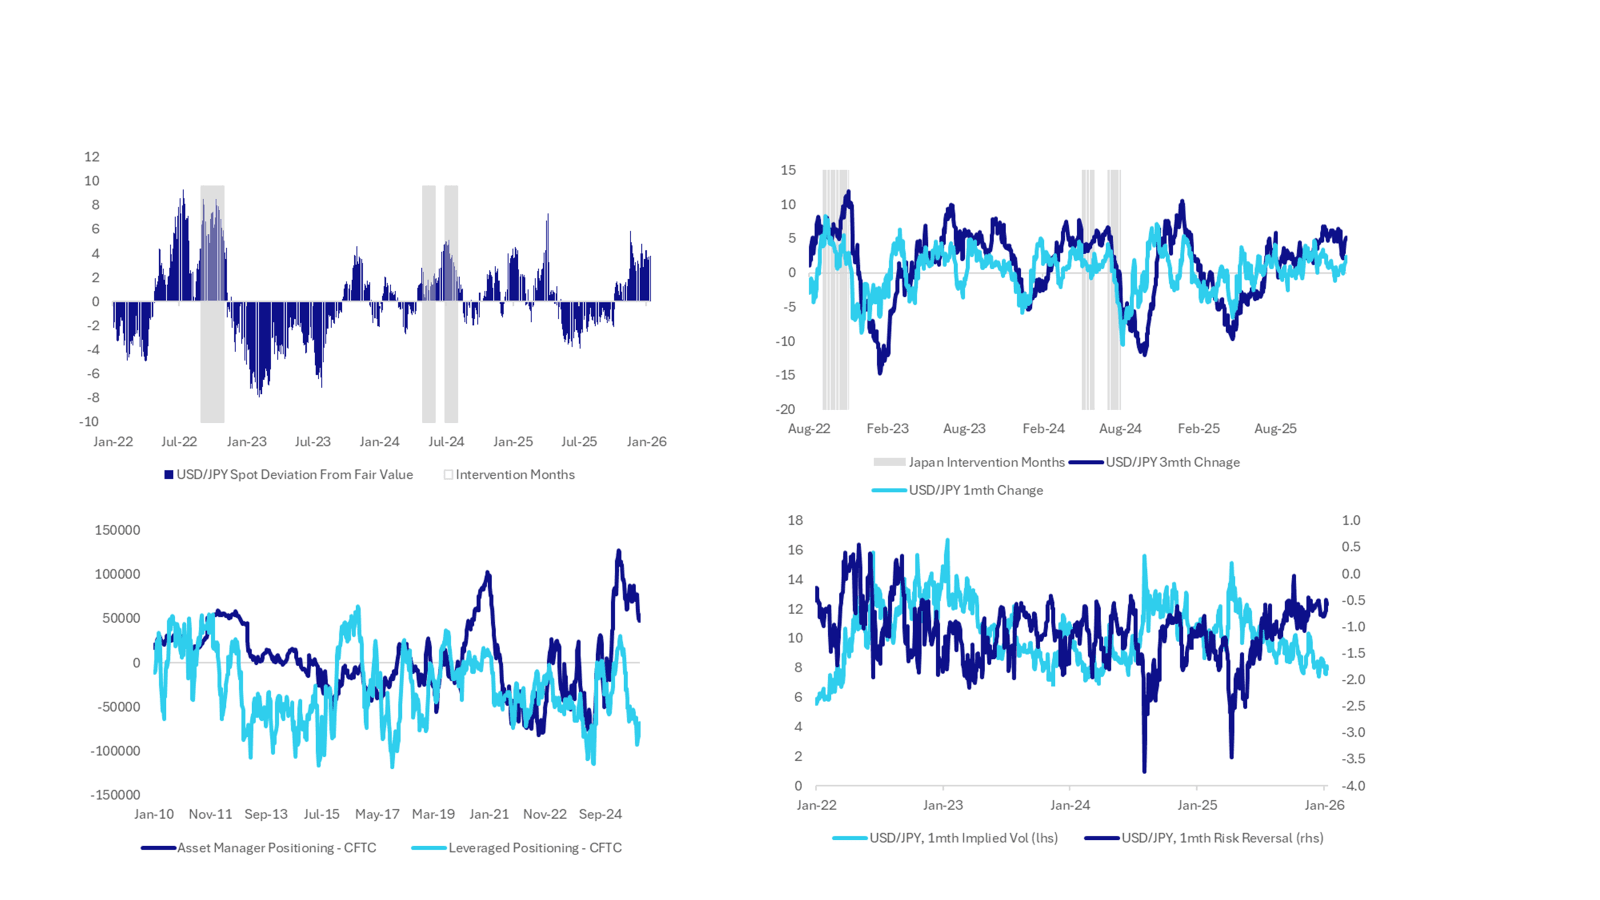
Source: Bloomberg Finance L.P./MNI
EUR: EUR/USD - 1.1700 Caps Move, Looks Like We Tread Water For Now
The overnight range was 1.1663 - 1.1699, Asia is currently trading around {EURUSD Curncy}. The pair found sellers again back toward 1.1700 capping the knee-jerk reaction to the Fed news. We are firmly back in the wider 1.1450-1.1850 range which dominated the last 6 months of the year and we need a catalyst to get a break and some sort of a trend going again. On the day it looks likely we tread water within a narrower 1.1600-1.1725 range as the market looks for a trigger to regain some momentum.
- The EUR/USD Average True Range for the last 10 Trading days: 43 Points
Fig 1 : EUR/USD Spot Daily Chart
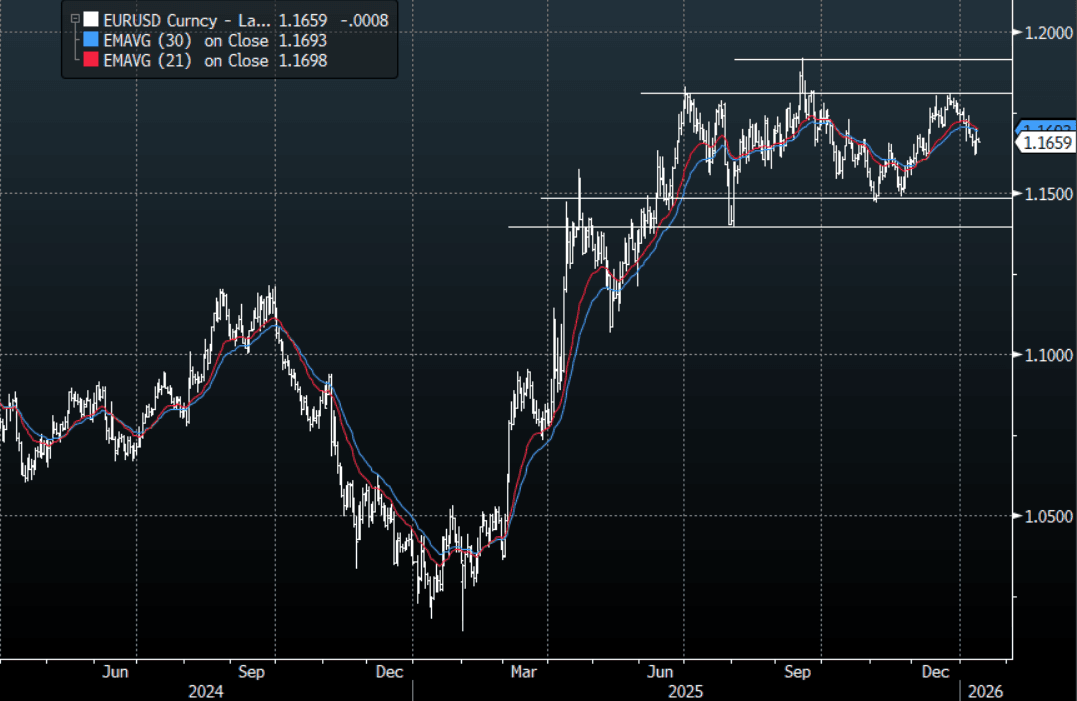
Source: MNI - Market News/Bloomberg Finance L.P
USD: BBDXY - Looks Directionless Within 1205-1215 For Now
The BBDXY range overnight was 1207.54 - 1210.11, Asia is currently trading around {BBDXY Index}. The USD found some support around the 1208 area after the initial knee-jerk lower. This leaves the USD in the middle of its recent range without any clear direction. On the day, it looks like 1205-1215 should cover it for now, watch for any ruling from the Supreme court as well as a potential incursion into Iran to maybe shake it up a little. This lack of a trend is being reflected in the CFTC data which shows very little positioning in the USD Index to start the year.
- MNI INTERVIEW: Fed Could Cut Around 100BP This Year-Bell. The Federal Reserve has ample room to keep cutting interest rates despite a robust economic backdrop because inflation excluding factors like shelter is already near target and the job market is effectively stalled, former IMF economist Gerwin Bell told MNI. {NSN T8R4IB6QRTHC <GO>}
- The BBDXY Average True Range for the last 10 Trading days: 339 Points
Fig 1: BBDXY Daily Chart
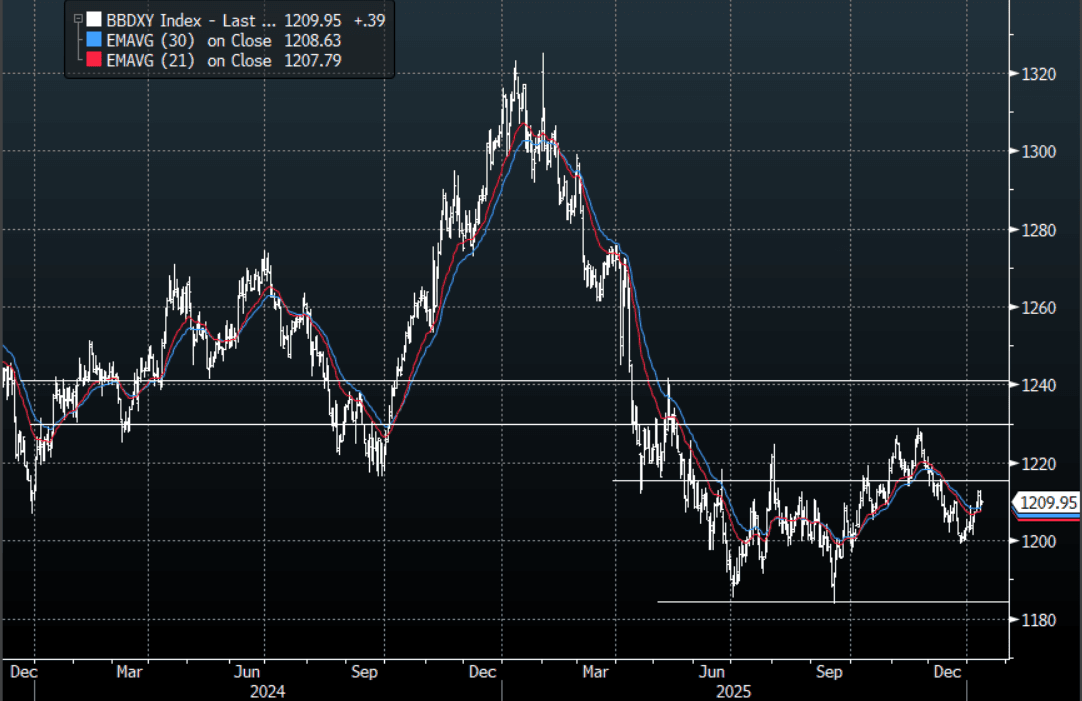
Source: MNI - Market News/Bloomberg Finance L.P