JAPAN DATA: Core Machine Orders Above Forecasts, Suggesting Resilient Capex
Japan June core machine orders were better than forecast. We rose 3.0%m/m, versus -0.5% forecast and -0.6% prior. The y/y print was 7.6%, against a 4.7% forecast and 4.4% prior. The chart below overlays y/y core machine orders (the white line on the chart) against capex for Japan in y/y terms (ex Software). Today's machine orders print continues to paint a resilient capex picture for Japan's economy.
- We don't get the full capex read for Q2 until the start of Sep. Still, the recent Q2 GDP print (preliminary) showed business up 1.3% in Q2, which was above forecasts (+0.7%). So today's core machine orders result is consistent with that backdrop.
Fig 1: Japan Core Machine Orders & Capex Y/Y (Ex Software)
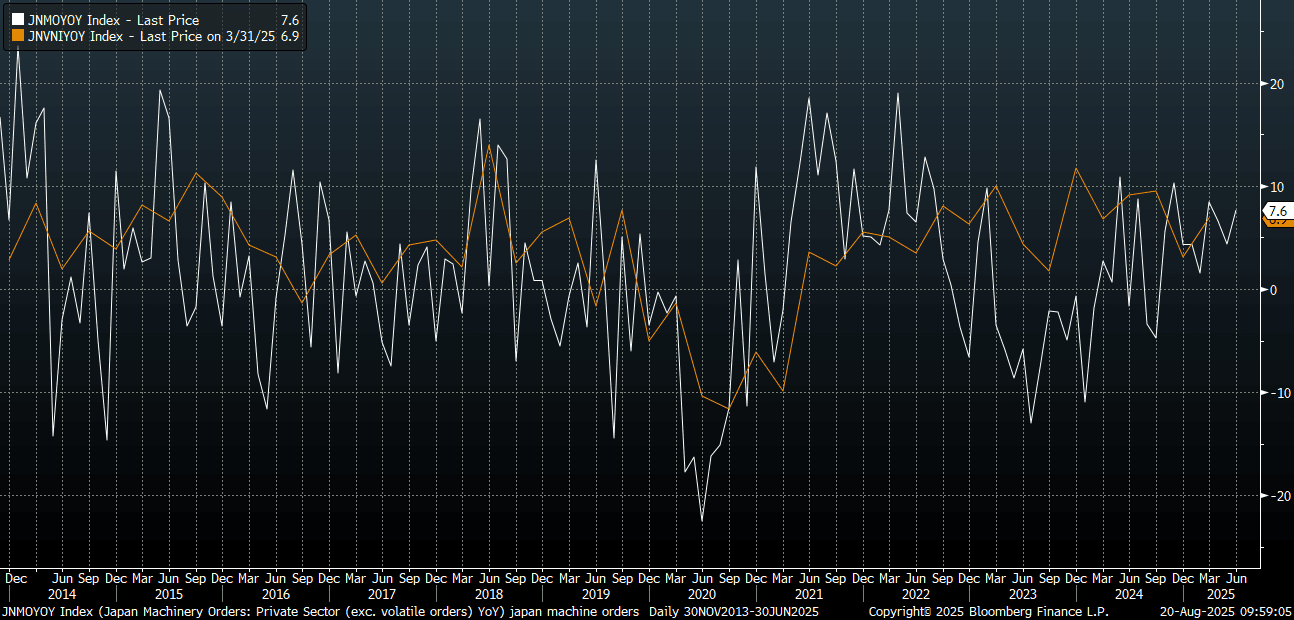
Source: Bloomberg Finance L.P./MNI
Want to read more?
Find more articles and bullets on these widgets:
Historical bullets
AUD: AUD/USD - Consolidating In A 0.6450 - 0.6600 Range For Now
AUD/USD - Continues To Consolidate
The AUD/USD had a range Friday night of 0.6498- 0.6541, Asia is trading around 0.6510. The pair found decent supply back towards 0.6550 again On Friday. The follow through below 0.6500 is quite disappointing for AUD shorts but with Stocks making new highs and risk outperforming, it makes it a hard environment for AUD/USD to collapse in. The Pair looks to be consolidating in a 0.6450 - 0.6600 range as we await a catalyst to provide clearer direction.
- (Bloomberg) -- “Indonesia is set to issue its first Australian dollar-denominated debt as the two countries strengthen their financial partnership.”
- “Aussie Banks' Credit, Cost Headwind to Prompt 2026 Profit Misses: Australian banks are on track for profit misses up to 15% in fiscal 2026, prompted by normalizing credit, cost-inflation and surging investment expenses that'll push up cost-to-income ratios. These factors will accentuate margin pressure from Reserve Bank of Australia rate cuts that are unlikely to offset expected strong loan growth.” - BBG
- Options : Closest significant option expiries for NY cut, based on DTCC data: 0.6600(AUD729m), 0.6500(AUD821m) . Upcoming Close Strikes : 0.6650(AUD495m July 24) - BBG
- CFTC Data shows Asset managers have maintained their shorts -38267, the Leveraged community added slightly to their shorts to -20048.
Fig 1: AUD/USD spot 120min Chart
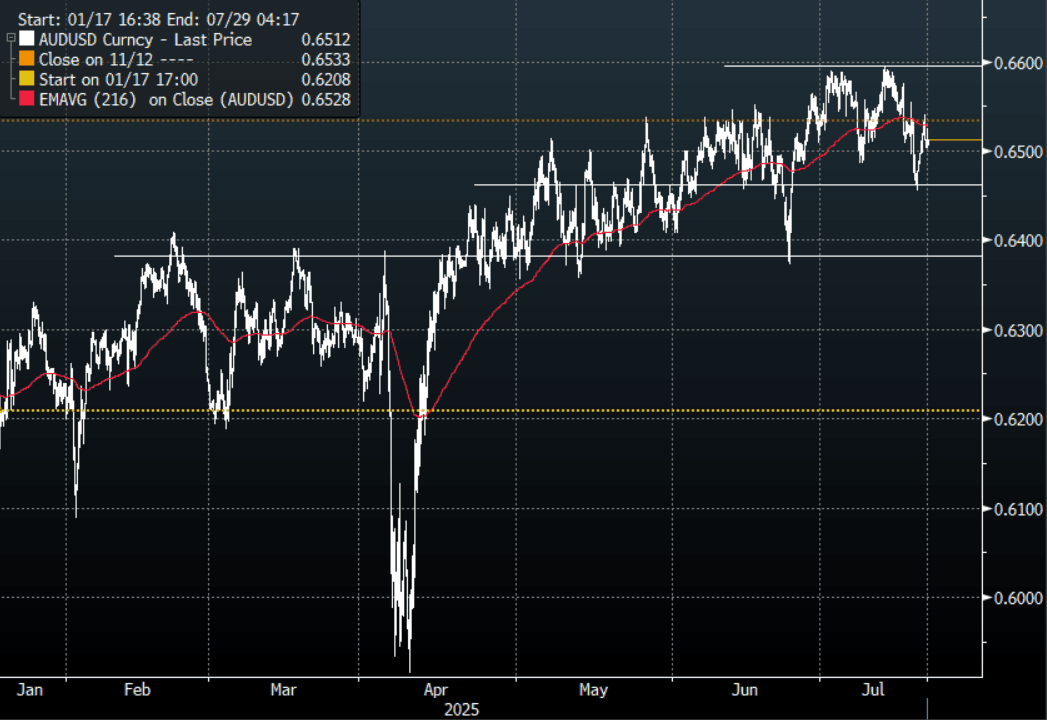
Source: MNI - Market News/Bloomberg Finance L.P
STIR: RBNZ-Dated OIS Softer After Q2 CPI Miss
RBNZ-dated OIS pricing is 5-8bps softer across meetings following today’s Q2 CPI data.
- While Q2 NZ headline CPI picked up 0.2pp to 2.7% y/y, it was less than expected and only 0.1pp above the RBNZ’s May forecast, and so well within usual errors. Thus, the RBNZ is likely to cut rates 25bp when it announces its decision on August 20.
- There was also a moderation in domestically driven non-tradeables inflation to its lowest in four years.
- 21bps of easing is priced for August, with a cumulative 37bps by November 2025 versus 16bps and 30bps before the data.
Figure 1: RBNZ Dated OIS Post-CPI vs. Pre-CPI (%)
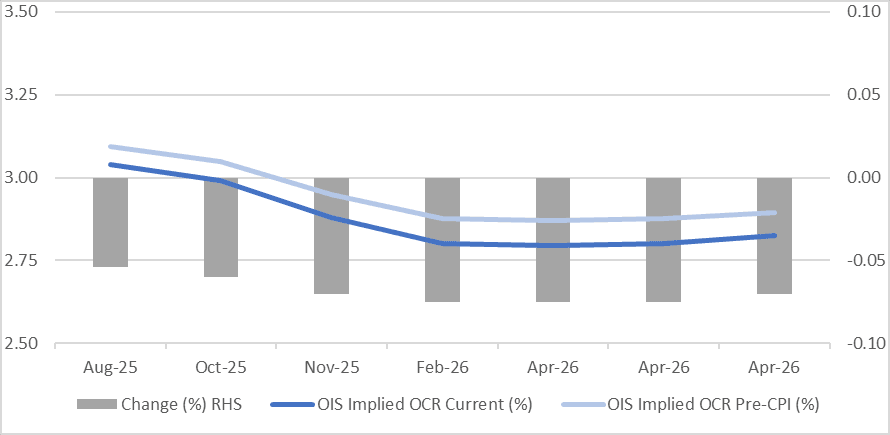
Source: Bloomberg Finance LP / MNI
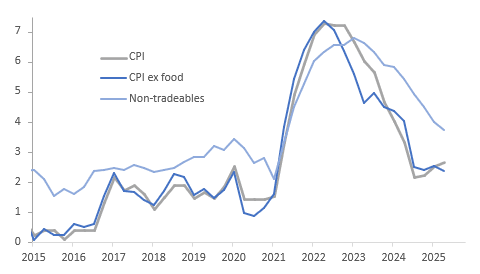
NEW ZEALAND: Inflation Low Enough For August Cut, Core Out Later Today
While Q2 NZ headline CPI picked up 0.2pp to 2.7% y/y, it was less than expected and only 0.1pp above the RBNZ’s May forecast and so well within usual errors. Thus the RBNZ is likely to cut rates 25bp when it announces its decision on August 20. There was also a moderation in domestically-driven non-tradeables inflation to its lowest in four years.
- Q2 CPI rose 0.5% q/q, in line with RBNZ expectations, bringing the annual rate to 2.7% from 2.5%, the highest in a year. Higher food prices, which had been signalled by the monthly data, were a reason for the pickup as CPI ex food rose 0.2% q/q and 2.4% y/y, down from 2.5% in Q1, the lowest since Q1 2021.
- The monthly data had also flagged a strong rise in electricity prices which rose 4.9% q/q and contributed 25% of the quarterly CPI increase, according to Statistics NZ.
- Non-tradeables rose 0.7% q/q to be up 3.7% y/y after 4.0%, while tradeables rose 0.3% q/q to be up 1.2% y/y following Q1’s 0.3%.
- Non-tradeables inflation was supported by the 12.2% y/y increase in local authority rates, but it will be updated in Q3 to capture July 1 rises. Rents rose 3.2% y/y, the lowest since 2021.
- RBNZ data on core inflation from its sector factor model will be released at 1300 AEST/1500 NZST today.
NZ CPI y/y%