JGBS: cheaper, 2/30 YC Back Near Highs Ahead Of 20Y Supply
In Tokyo morning trade, JGB futures are weaker, -14 compared to settlement levels.
- Japan's Sep core machine orders were comfortably above market forecasts, although arguably this was a risk after the recent Q3 GDP preliminary print (which showed stronger than expected business spending in Q3). From a policymaker's standpoint, it suggests resilience/strength in the business/capex sector (reinforcing what the Q3 GDP print stated).
- Focus will be on if these trends sustain into Q4, while the wage outlook is also a key BoJ watchpoint. Our policy team notes that key wage data will not be available until the Jan policy meeting next year. This sets up a possible Dec hold from the BoJ (although sharp yen weakness could prompt a move).
- Cash US tsys are little changed in today's Asia-Pac session. Nvidia’s earnings are in focus and due after the market close on Wednesday.
- Cash JGBs are 1-2bps cheaper across benchmarks. The benchmark 20-year yield is 1.3bps higher at 2.80% versus the cycle high of 2.816%, set yesterday.
- Moreover, the 2/30 yield curve moved back to September highs. (see chart)
- Swap rates are 2bps higher to 1bp lower, with a flattening bias.
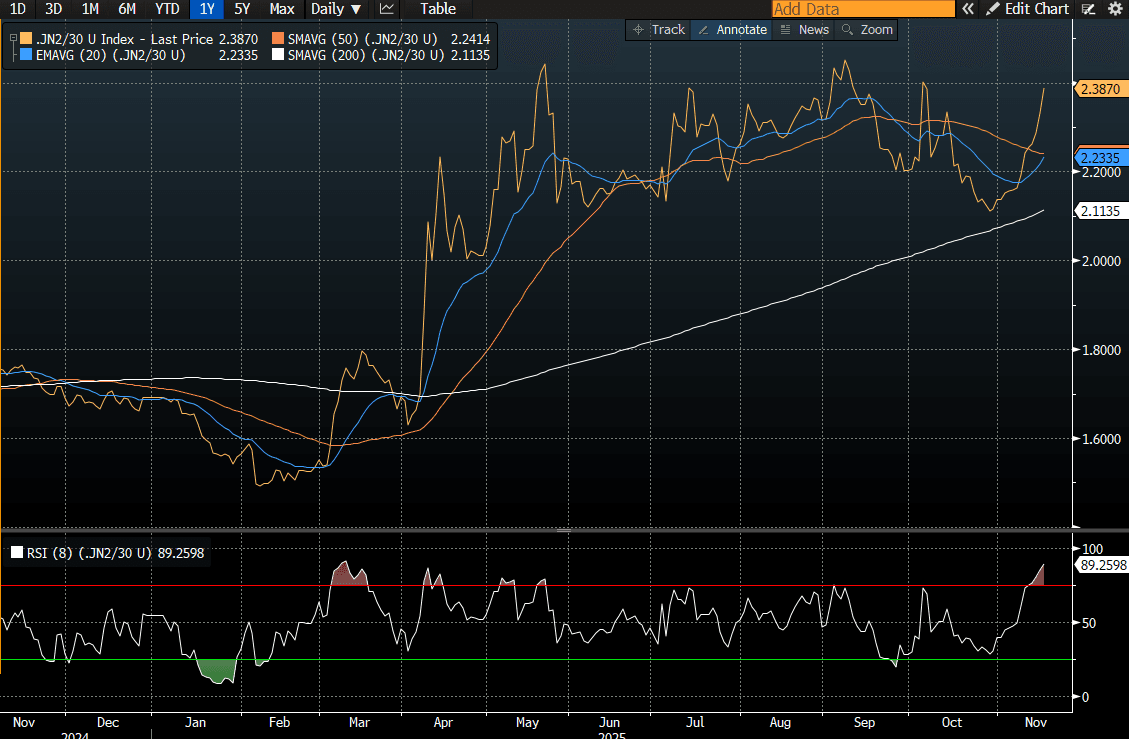
Source: Bloomberg Finance LP
Want to read more?
Find more articles and bullets on these widgets:
Historical bullets
CNH: US-China Trade Talks May Help Cap USD/CNH Upside, Busy Data Day Today
USD/CNH spot remains within broader ranges, last near 7.1260. Sellers in the pair are likely to re-emerge on moves back towards the 50-day EMA (near 7.1420/25), while the 20-day is close to 7.1335. The dialing down of 100% tariff risks on Friday, as Trump stated such levels (on top of existing tariff levels) were unsustainable, should help keep the upside in USD/CNH capped. From late last week it also emerged that US Treasury Secretary Scott Bessent and China Vice Premier He Lifeng will meet this week (in Malaysia) ahead of the two Presidents meeting.
- On the downside though, we are still above recent lows (7.1168), while further downside focus will rest at the 7.1000 region. Any move lower in the pair is expected to be gradual rather than dramatic. Implied 1 month vol is back under 3%, so off recent highs, but quite low from an historical standpoint.
- US-China trade talks are overshadowing what is a busy data day today. The loan prime rates are expected to be on hold, while Sep home prices will be in focus, in light of recent easing measures/reduced restrictions in this space.
- We also have Q3 GDP, which is expected to moderate to 4.7%y/y from 5.2%. Sep activity figures are also out. Retail sales and IP are expected to moderate further in y/y terms.
- Decent downside surprises may raise easing expectations ahead of year end. Any CNH underperformance may be best expressed via crosses or through the CFETS CNY basket.
STIR: RBNZ-Dated OIS Pricing Little Changed After Q3 CPI
Q3 CPIs are unlikely to derail any further easing at the 26 November RBNZ meeting after the 50bp this month.
- Headline rose 1% q/q bringing annual inflation to 3.0% y/y from 2.7%, the top of the RBNZ’s target band but there had been fears that it could go above.
- Domestically-driven non-tradeables were slightly higher than the RBNZ expected at 1.1% q/q but the annual rate at 3.5% was in line. Its measure of core will print today at 1500 NZDT/1300 AEDT.
- RBNZ dated OIS pricing is little changed across meetings. 26bps of easing is priced for November, with a cumulative 36bps by February 2026.
Figure 1: RBNZ-Dated OIS: Post-CPI vs. Pre-CPI

Source: Bloomberg Finance LP / MNI
CHINA: Equity Valuations: Onshore Offshore Valuation Gap Widening
A lot of focus has been on the onshore equity rally. The CSI 300 has delivered gains of over +11% over the last 3 months, whilst over the same period the Hang Seng is up +1.7%. The onshore / offshore divergence is a key theme at present, given the divergence in valuations. The P/Es onshore now are elevated on a historical basis, even when compared to the post COVID period. At 17.5x for the CSI 300, forecasts are for a year end close at 15.9x and 2026 a further decline. The Hang Seng by comparison is currently at 11.6x and forecast to rise to 12.2x by year end.
Fig 3: CSI 300 Price to Earnings

Source: Bloomberg Finance LP / MNI
Fig 4: Hang Seng Price to Earnings

Source: Bloomberg Finance LP / MNI