EU CONSUMER CYCLICALS: Campari: Secondary
* Hearing MSD tighter...
Want to read more?
Find more articles and bullets on these widgets:
Historical bullets
US TSYS: Early SOFR/Treasury Option Roundup
SOFR & Treasury options trade outlined below. Wing buyers on net after better unwinds late last week. Underlying futures modestly lower, inside narrow overnight ranges. Projected rate pricing vs. late Friday lvls (*): Jun'26 at -1.2bp (-1.5bp), Jul'26 at -2.1bp (-3.1bp), Sep'26 at -2.0bp (-3.2bp), Oct'26 at -0.1bp (-1.1bp), Dec'26 +3.1bp (+1.5bp).
- SOFR Options:
- +10,000 0QV6 96.06/96.31 put spds, 9.75 ref 96.335
- +5,000 SFRZ6 96.62/96.75/96.87/97.25 call condor, 0.0
- +2,000 SFRN6 96.31/96.43/96.56 call flys, 2.25 ref 96.325
- +2,500 SFRM7 97.50 calls, 8 ref 96.255/0.10%
- +2,000 SFRU6 96.37/96.50 call spds, 2.25
- -2,500 SFRM6 96.43 calls, 1.0 ref 96.355
- 3,000 0QZ6 95.25/95.75 put spds ref 96.325
- Block, +10,000 0QV6 96.06/96.31 put spds, 10.0 ref 96.325
- Block, +2,500 SFRU6 98.00 calls, 1.5 vs. 96.34/0.10%
- -1,500 SFRU6/SFRZ6 96.31/96.43 put spd spds, 0.75 net/Sep over
- 1,500 0QK6 96.00/96.12/96.37 broken put flys, 13 ref 96.21
- Treasury Options:
- 2,000 TYN6 109/110.5/112 call flys
- 4,000 TYM6 110.25 puts, 17 ref 110-20
- 1,650 FVM6 109.25 calls, ref 107-23
- +1,600 FVQ6 107/108 call spds, 37
- +7,000 TYM6 109.5/110.5 put spds, 16
- +1,000 USM6 113.5/114/114.5/115.5 broken call condors, 5
- +1,000 FVM6 107.75 straddles, 32 vs. 107-28.5/0.02%
- -2,250 TYQ6 108 puts, 21 vs 110-10.5
- +2,100 TUQ6 103.5/103.75 call spds, 7.5
- -10,000 TYM6 108.5/111 put spds, 36 net ref 110-19
- TYM6 109 puts, 3 ref 110-18.5
- -1,500 TYM6 110 puts, 12 vs. 110-17/0.29%
- 2,500 FVM6 107.25/107.75 2x1 put spds, 4 ref 107-23.25
MNI: US NAR: APR EXISTING HOME SALES 4.02M SAAR
- MNI: US NAR: APR EXISTING HOME SALES 4.02M SAAR
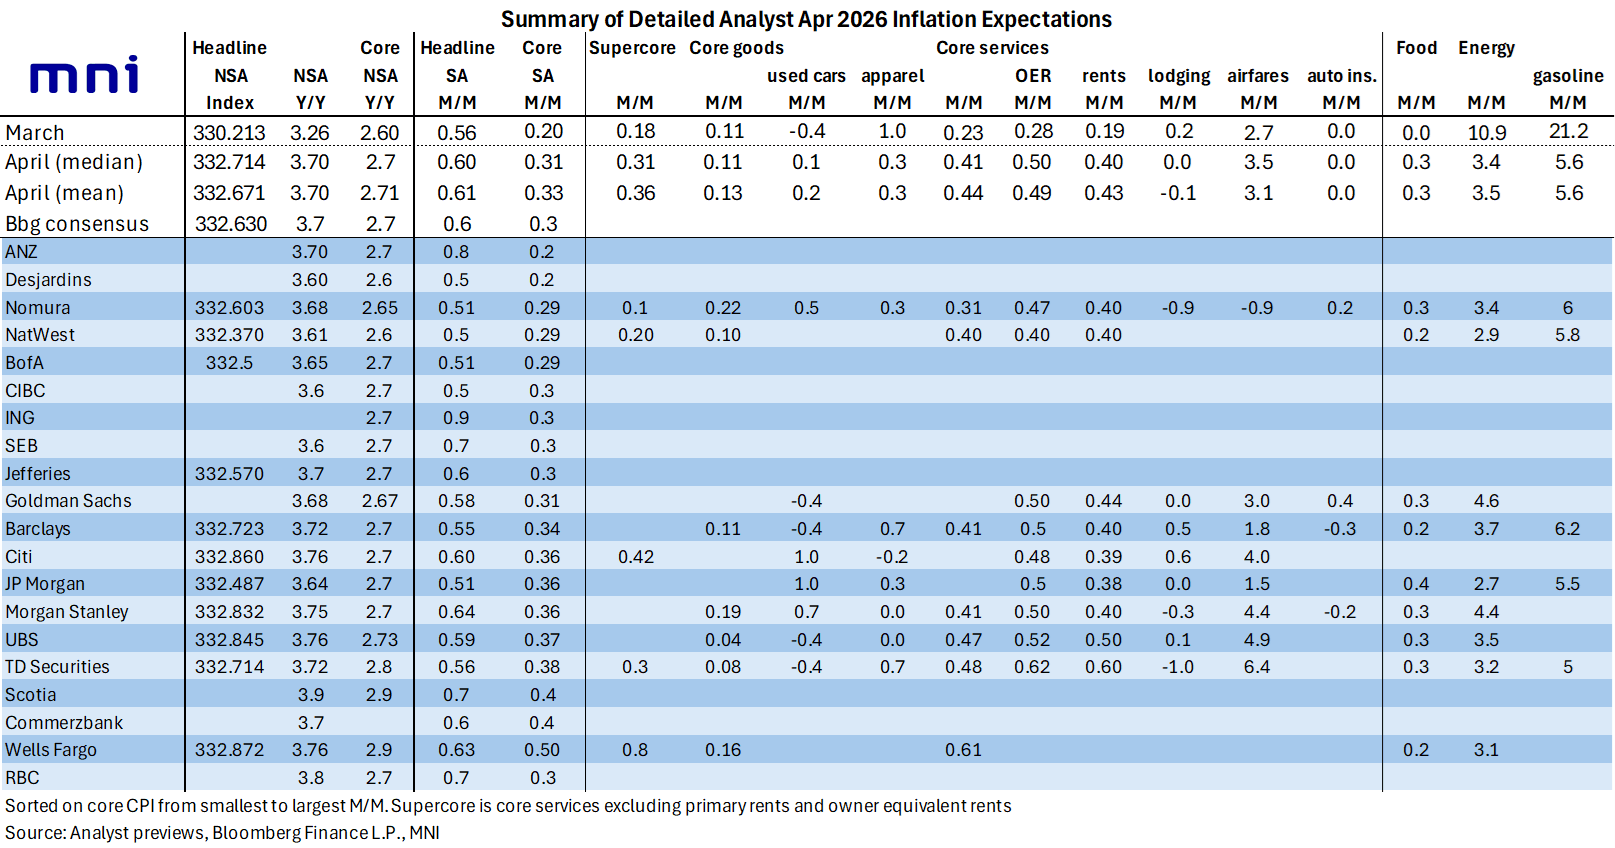
US INFLATION: Main Expected Drivers Of US CPI In April
Energy inflation won’t be able to match its March surge, acting as a sequential drag, although food inflation should bounce:
- Food (+ve): Food inflation is expected to have returned to a more typical 0.3% M/M after an unusually soft March at -0.01% M/M when food at home fell -0.16% M/M (largest decline since Apr 2025 and before that Mar 2023). This category should give an idea of passthrough from higher transportation and fertilizer costs.
- Energy (-ve): Energy prices are expected to have seen a strong increase in April of ~3.5% M/M, again led by gasoline, but it should be much slower than the historically sharp 10.9% M/M energy increase in March.
For core, beyond an artificial boost for rental inflation, expect some offsetting drivers from travel-related services (airfares vs lodging). Core goods might also see some conflicting drivers, with used car prices no longer falling but softer apparel inflation somewhat countering that.
- Rents (large +ve): This is expected to be one of the main new drivers of core, with the six-month sample rotation seeing essentially twice the rate of inflation as it compares prices from a year ago rather than six months ago when they couldn’t be collected in Oct 2025 due to the government shutdown. The average estimate sees OER at 0.49% M/M (range 0.40-0.62) after 0.28% in March whilst primary rents is seen at 0.43% M/M (range 0.38-0.60) after 0.19% in March.
- Used cars (+ve): On average seen at 0.2% M/M (range -0.4 to 1.0%) after the surprisingly soft -0.4% M/M in March, with a lagged relationship with Manheim prices pointing to larger increases.
- Airfares (+ve): Mostly expected to show another strong increase (average 3.1% M/M sa) after 2.7% in March as high jet fuel prices feed through. There’s a wide range to estimates, from -0.9% to 6.4% M/M, for this category which doesn’t feed into core PCE.
- Lodging (-ve): Countering potentially faster airfares inflation, lodging is mostly expected to come in softer than in March, with an average estimate of -0.1% M/M for April (range -1.0% to 0.6%) after 0.2% in March.
- Apparel (-ve): Seen on average rising 0.3% M/M (range -0.2% to 0.7%) after two very strong increases of 1.0% in March and 1.3% in Feb in what was its strongest single month since 2018. Nomura, close to the average estimate for apparel, cite a non-seasonally adjusted decline in the Adobe Digital Price series.
[Note that the below table shows an updated estimate for UBS, with core seen at 0.37% M/M vs the 0.41% in our initial unrounded-only table. It doesn't alter the unrounded-only median of 0.36% M/M for core (or 0.56% M/M for headline).]