USDCAD TECHS: Bull Cycle Extension
* RES 4: 1.4095 1.236 proj of the Mar 9 - 31 - May 1 price swing * RES 3: 1.4051 High Nov 28 2025 * ...
Want to read more?
Find more articles and bullets on these widgets:
Historical bullets
USDCAD TECHS: Pierces The 50-day EMA
- RES 4: 1.3869 76.4% retracement of the Mar 31 - May 1 bear leg
- RES 3: 1.3808 61.8% retracement of the Mar 31 - May 1 bear leg
- RES 2: 1.3758 50.0% retracement of the Mar 31 - May 1 bear leg
- RES 1: 1.3725 High May 12
- PRICE: 1.3703 @ 16:13 BST May 13
- SUP 1: 1.3620 Low May 7
- SUP 2: 1.3550/26 Low May 1 / Low Mar 9
- SUP 3: 1.3508 1.0% 10-dma envelope
- SUP 4: 1.3482 Low Jan 30 and key support
A corrective cycle in USDCAD remains in play and this week’s gains reinforce this S/T condition. Resistance at 1.3711, the 50-day EMA, has been pierced. A clear break of it is required to signal a stronger short-term reversal and open 1.3758, a Fibonacci retracement. For bears, a resumption of weakness would pave the way for a move towards 1.3526, the Mar 9 low and the next key support. A clear break of this level would open 1.3482, the Jan 30 low.
US INFLATION: MNI US Inflation Insight: Energy And Services Pack A Punch
We've published our US Inflation Insight for May - Download Full Report Here
Soaring energy prices amid the conflict in the Middle East continued to punctuate the overall strength in inflation in April. Consumer price inflation was slightly hotter than expected, with some unexpected softness in core goods offset by strong services dynamics – but headline producer price inflation was scorching (less so on core). Overall, sequential core PCE looks to have been relatively steady in April vs March and won’t allay the FOMC’s growing concerns that the dual mandate balancing act is turning decisively to an inflation-fighting battle.
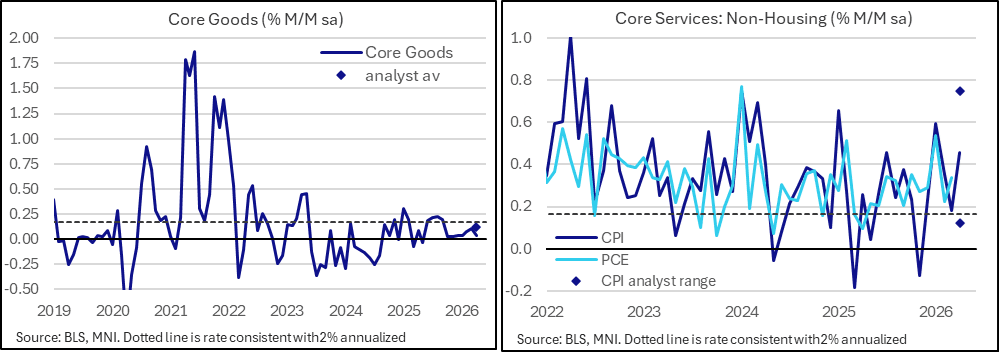
- The sequential pickup in core CPI % M/M in April (to 0.38% vs 0.36% consensus from 0.20% in March) was largely driven by services, while headline registered 0.64% M/M (vs 0.56% consensus, 0.87% prior), driven by a continued surge in energy and a pickup in food prices.
- The pickup in services was primarily due to the doubling of housing's contribution to core CPI, to 0.23pp from 0.11pp. This was expected given April's methodological quirk that pays back for last October's missing data due to the government shutdown and will reverse next month.
- But even outside of that, services printed on the high side: Core services excl OER & primary rents ('supercore'): 0.454% M/M after 0.179% prior, around the middle of a very wide range of expectations.
- Conversely, with the exception of apparel, core goods CPI inflation was surprisingly tepid in April, with our estimate of median inflation echoing this.
- The main inflation gauges in the April PPI report substantially exceeded expectations, with the details not offering much comfort either. The headline final demand PPI came in at 1.4% M/M, well above the 0.5% consensus and the Y/Y reading at a post-2022 high 6.0% (4.8% expected). Mitigating the impact of the report is that a large portion of the overall rise was in trade services, meaning that the main core aggregate - ex-food/energy/trade services - was closer to the expected mark at 0.6% M/M (consensus 0.3%) though the Y/Y gauge rose to 4.4% (4.2% consensus), the highest since Feb 2023.
- Analyst estimates for April core PCE were little changed but mostly lower after the PPI report, with the subcomponents seen as mixed. With expectations for core PCE after the CPI report having centered around 0.31% M/M, they now appear to be closer to 0.30%, similar to March's 0.29%.
- The CPI/PPI combo failed to move the needle much on Fed pricing, with futures currently implying 9-10bp of cumulative Fed tightening by year-end, the same as just prior to the CPI release Tuesday. That said, it kept the broader uptrend in place, with expectations briefly at 11bp following the PPI report.
AUDUSD TECHS: MA Studies Highlight A Dominant Uptrend
- RES 4: 0.7358 1.764 proj of the Apr 29 - May 1 - 5 price swing
- RES 3: 0.7343 Top of a bull channel drawn from the Apr 9 ‘25 low
- RES 2: 0.7300 Round number resistance
- RES 1: 0.7278 1.000 proj of the Apr 29 - May 1 - 5 price swing
- PRICE: 0.7259 @ 16:12 BST May 13
- SUP 1: 0.7175 20-day EMA
- SUP 2: 0.7097 50-day EMA
- SUP 3: 0.6986 Low Apr 13
- SUP 4: 0.6899 Low Apr 7
The trend needle in AUDUSD continues to point north and the pair is trading closer to its recent highs. Note too that moving average studies are in a bull-mode position, highlighting a dominant uptrend. Scope is seen for an extension towards the 0.7300 handle next. Further out, sights are on 0.7343, the top of a bull channel drawn from the Apr 9 ‘25 low. Initial support lies at the 20-day EMA, at 0.7175.