UK DATA: BRC Footfall Rises Y/Y on Easter Timing Boost, Likely to be Short-Lived
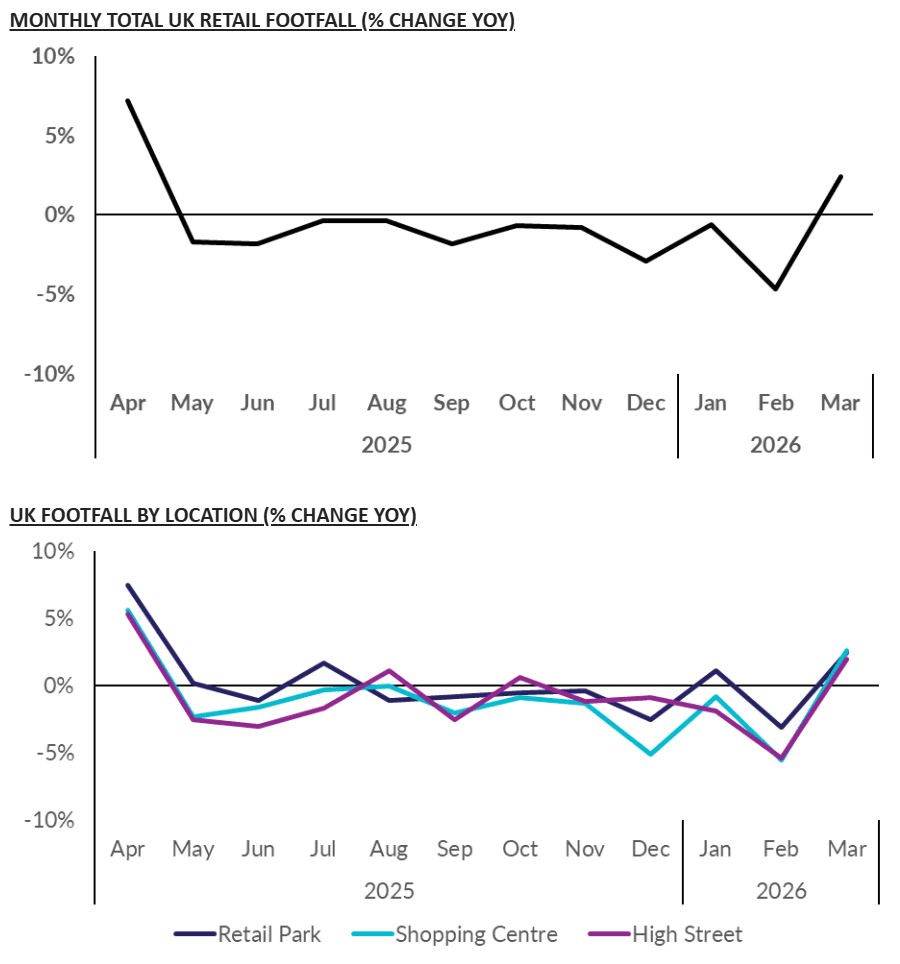
UK footfall grew 2.4% Y/Y in March, up from February's notably weak -4.7% (following -0.6% Jan). Although the figure is the strongest (and first positive reading) since last April, it is distorted by the Easter weekend falling partly in March's reporting period this year (vs entirely in April last year), and we note that March 2025 saw footfall drop around -5% Y/Y for a favourable base effect. It's hard to interpret this print without waiting for context from April's data.
- The press release notes that "Without the final week’s Easter bump, March would likely have remained in negative territory".
- The reporting period covers the five weeks 1 Mar - 4 Apr 2026, meaning it includes the Easter weekend up to just before Easter Sunday, whereas last year Easter fell into April's reporting period.
- This is notable given the BRC's upcoming retail sales data (due next Tues) and the official ONS retail sales data both use the same reporting periods (the ONS data will be seasonally adjusted for Easter, though there are concerns about its effectiveness and the M/M figures are more closely watched there).
- Given that last year's April reading instead saw a strong boost from Easter (around 7% Y/Y growth), it wouldn't be surprising to see this year's strong March reading reverse sharply next month, particularly if consumers remain cautious.
- On consumer sentiment, the press release comments: "Ongoing pressures continue to shape consumer behaviour. Declining confidence, geopolitical uncertainty and rising living costs – especially fuel – are still encouraging caution and fewer discretionary trips."
- “Looking ahead, the conflict in the Middle East is weighing heavily on both retailer and consumer confidence, with further pressure on the cost of living potentially likely to hit footfall."
- Footfall rose in all three location categories in March: shopping centres up 2.6% Y/Y (-5.5% Feb), retail parks up 2.5% Y/Y (-3.1% Feb), and high streets up 2.0% Y/Y (-5.4% Feb).
Want to read more?
Find more articles and bullets on these widgets:
Historical bullets
EQUITY TECHS: E-MINI S&P: (H6) Bounce Considered Corrective
- RES 4: 6983.75 High Feb 25
- RES 3: 6894.74 50-day EMA
- RES 2: 6872.49 20-day EMAl
- RES 1: 6833.50 Intraday high
- PRICE: 6803.50 @ 07:21 GMT Mar 11
- SUP 1: 6714.75 Low Mar 6
- SUP 2: 6583.00 Low Nov 21 ‘25 and a key medium-term support
- SUP 3: 6534.52 1.382 proj of the Feb 25 - Mar 3 - 5 price swing
- SUP 4: 6503.25 1.500 proj of the Feb 25 - Mar 3 - 5 price swing
A sharp bounce in S&P E-Minis on Monday appears corrective - for now - and this has allowed an oversold trend condition to unwind. The recent breach of 6751.50, the Feb 6 low, confirms a range breakout and highlights a stronger short-term bear threat. A resumption of weakness would open 6583.00, the Nov 21 ‘25 low and a key medium-term support. Initial firm resistance is 6890.53, the 50-day EMA.
RBA: VIEW: CBA Look For Hikes In March & May
CBA now expect the RBA to hike rates in both March and May.
- They write “the March Board meeting is being set in a very different context to what was expected just two weeks ago. The war in the Middle East has set an uncertain backdrop to the meeting. Inflation will lift further away from target from here as energy and other linked goods prices rise, but the impact on growth remains highly uncertain. Inflation is already too high, the economy is already breaching its capacity limit and the labour market is tight. The domestic data flow since the February meeting has confirmed that higher interest rates are needed”.
- “There are good reasons the RBA could decide to wait till May and we still consider it a line ball decision. Recent commentary from the RBA has confirmed the hawkish stance and focus on inflation”.
WTI TECHS: (J6) Key Support Zone Intact For Now
- RES 4: $125.00 - Round number resistance
- RES 3: $123.68 - High Jun 14 ‘22 (cont) and a key resistance
- RES 2: $120.00 - Psychological round number
- RES 1: $98.11/119-48 - 50.0% of the Mar 9 - 10 sell-off / High Mar 9
- PRICE: $83.60 @ 07:18 GMT Mar 11
- SUP 1: $76.73 - Low Mar 10
- SUP 2: $73.64 - 20-day EMA
- SUP 3: $67.06 - 50-day EMA
- SUP 4: $63.60 - Low Feb 26
A volatile impulsive bull wave in WTI futures remains intact. From a technical analysis standpoint alone, the sharp pullback from Monday’s high is not a surprise, given that the uptrend was in an extreme overbought position. The move down is allowing this overbought condition to unwind. A key support zone to monitor is $73.64 - $67.06, the area between the 20- and 50-day EMAs. A clear break through this area would signal a possible trend reversal.