JPY: Asia Wrap - BOJ Raises Inflation Forecast To Help JPY
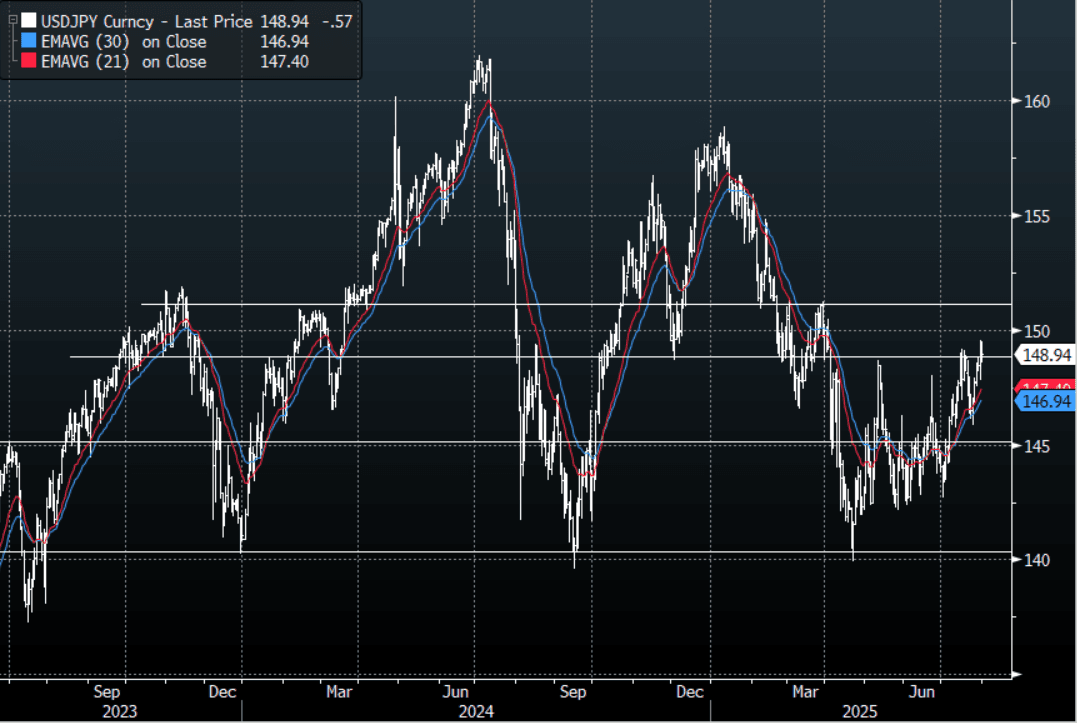
The Asia-Pac USD/JPY range has been 148.59 - 149.51, Asia is currently trading around 148.80, -0.45%. USD/JPY drifted lower into the BOJ and then took another leg as inflation forecasts were raised. The pair caught between a hawkish Powell and a hawkish BOJ. How the USD trades going into the NFP print tomorrow will probably dictate short-term moves. First support back towards 146/147 and on the topside the pivotal 151/152 area remains key.
- "BOJ Keeps rates unchanged, raises FY2025 inflation forecast to 2.7% from 2.2%" - BBG
- (Bloomberg) - “The BOJ’s hold decision looks at least as hawkish as the Fed’s, meaning that traders should start seriously considering September’s meeting as a live one for a Japanese rate hike.”
- JAPAN DATA Local Investors Sell Offshore Debt, But Recent Trends Still Positive: Offshore flows for Japan bond and equity markets were mixed last week. Local investors sold offshore bonds for the first time since early June. Since mid June we have had cumulative buying for this segment of over 5.6trln, including the modest outflow last week. Hence the trend still remains positive for Japan purchases of offshore debt. Local investors bought overseas equities for the second straight week, but the cumulative trend over recent months remains negative.
- Options : Close significant option expiries for NY cut, based on DTCC data: 146.00($971m).Upcoming Close Strikes : 147.00($1.52b Aug 1), 146.00($1.43b Aug 1) - BBG.
CFTC data shows Asset managers surprisingly added slightly to their JPY longs +72326( Last +71610), while leveraged funds have slightly reduced their newly built short JPY position -11571(Last -12606).
Fig 1 : USD/JPY Spot Daily Chart
Source: MNI - Market News/Bloomberg Finance L.P
Want to read more?
Find more articles and bullets on these widgets:
Historical bullets
BONDS: NZGBS: Closed Richer, Bank Economists Shift To No RBNZ Cut In July
NZGBs closed just off session bests, with benchmark yields 4-5bps lower.
- Former RBNZ Acting Governor Grant Spencer has been appointed to the central bank board for a five-year term.
- (Bloomberg) ANZ Bank Chief Economist Zollner no longer sees the RBNZ cutting the cash rate at the July 9 meeting, predicting instead it will keep the rate at 3.25%. “From there, we are now forecasting a cautious pace of cutting with 25bp cuts in August and November, with a third 25bp cut in February to 2.50%”: Zollner.
- (Bloomberg) BNZ no longer expects the RBNZ will cut the OCR next week, Head of Research Toplis says. Says the NZIER survey of business opinion was simply not weak enough to give confidence that the RBNZ will cut the OCR from 3.25%.
- Swap rates closed 4-6bps lower, with a flatter 2s10s curve.
- RBNZ dated OIS pricing closed flat to 3bps softer across meetings. 4bps of easing is priced for July, with a cumulative 33bps by November 2025.
- Tomorrow, the local calendar will be empty.
- On Thursday, the NZ Treasury plans to sell NZ$225mn of the 4.50% May-30 bond, NZ$175mn of the 2.75% Apr-37 bond and NZ$50mn of the 2.75% May-51 bond.
FOREX: Asia FX Wrap - USD Makes New Lows, Doesn't Push On
The BBDXY has had a range of 1187.94 - 1190.09 in the Asia-Pac session, it is currently trading around 1189. The USD has traded sideways today after initially trying lower. CHINA CAIXIN PMI Surprises to the Upside: China's CAIXIN PMI Manufacturing in June rose to 50.4, ahead of an expected 49.3. The index was considerably up from the prior month's result of 48.3. This data captures the period post the agreement between the US and China on tariffs and potentially points to an improvement in activity. "US OFFICIALS WERE SEEKING PHASED DEALS WITH THE MOST ENGAGED COUNTRIES AS THEY RACE TO FIND AGREEMENTS BY JULY 9- FT - [RTRS]"
- EUR/USD - Asian range 1.1778 - 1.1807, Asia is currently trading 1.1790. While the USD remains on the back foot the EUR will continue to be supported, first support is back towards 1.1600. This move seems to be accelerating and will now be looking towards 1.2000 and beyond.
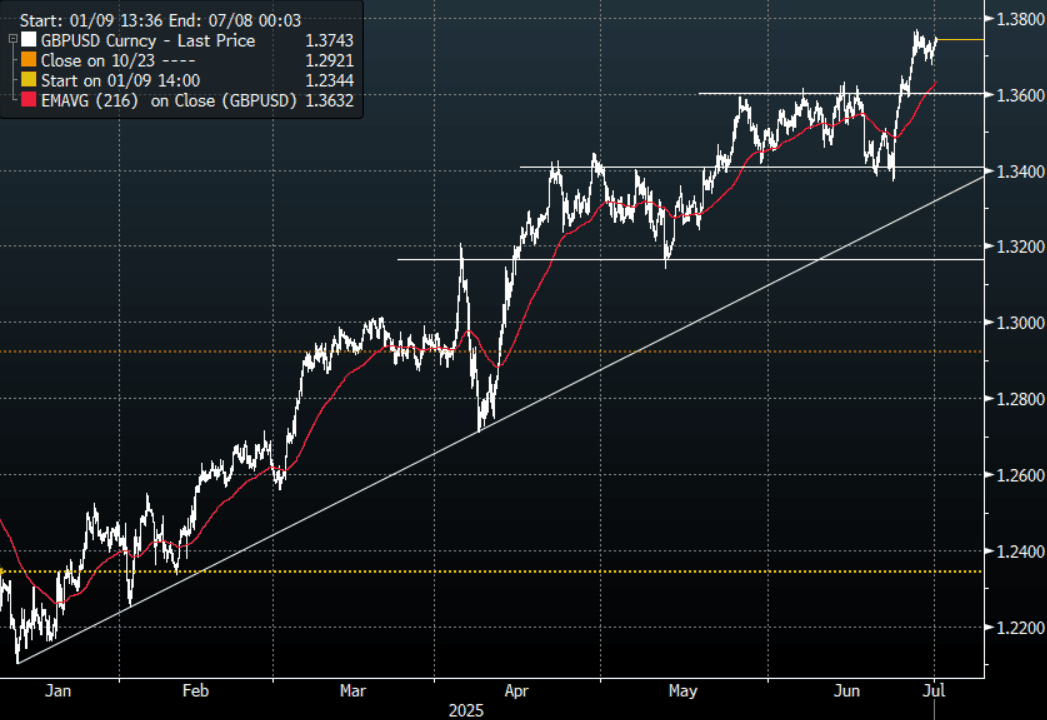
- GBP/USD - Asian range 1.3718 - 1.3749, Asia is currently dealing around 1.3740.This move higher now looks to have broken convincingly and with the USD looking like it is set for another leg lower Cable could potentially now target levels back towards 1.4200. Short-term momentum seems to be stalling first support back towards 1.3600.
- USD/CNH - Asian range 7.1501 - 7.1596, the USD/CNY fix printed 7.1534 Asia is currently dealing around 7.1580. Sellers should be around on bounces while price holds below the 7.2500 area and the PBOC manages the fix lower.
- Cross asset : SPX -0.15%, Gold $3325, US 10-Year 4.208%, BBDXY 1189, Crude oil $64.78
- Data/Events : Italy Man PMI, France Man. PMI, Germany Man. PMI & Unemployment, EZ Man. PMI & CPI,
Fig 1: GBP/USD Spot Hourly Chart
Source: MNI - Market News/Bloomberg Finance L.P
NZD: Asia Wrap - NZD/USD Dips Well Supported
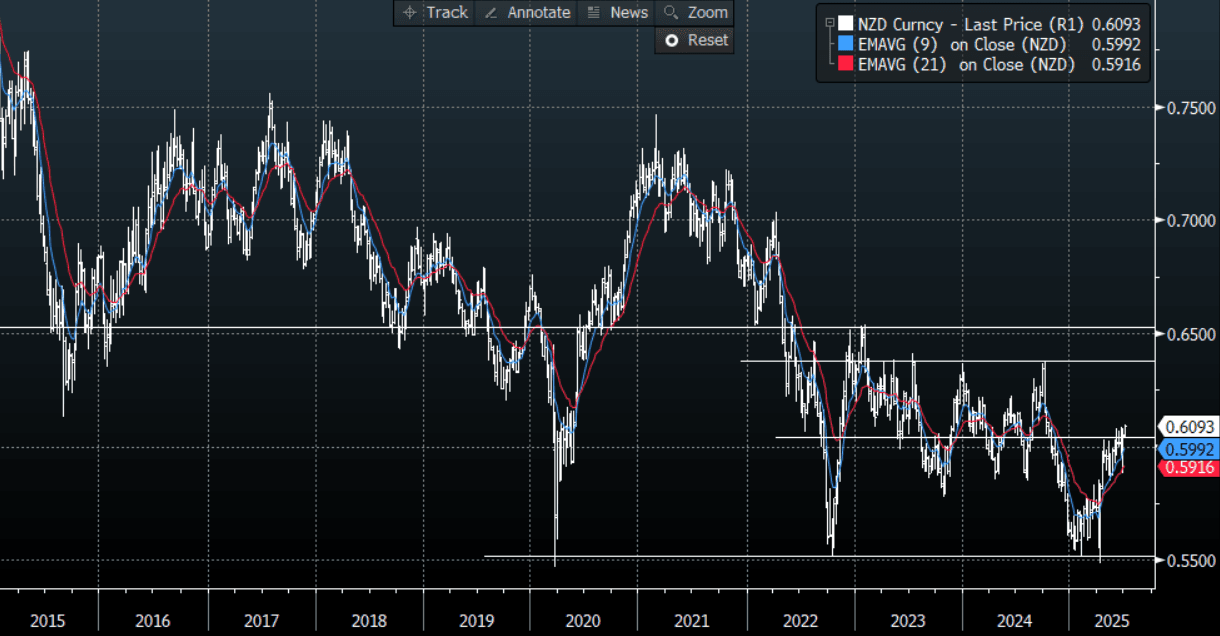
The NZD/USD had a range of 0.6076 - 0.6097 in the Asia-Pac session, going into the London open trading around 0.6095, -0.03%. A tight range in a relatively quiet Asian session, US Equity futures have also drifted lower in Asia, ESU5 -0.1%, NQU5 -0.1%. The pair is trying to break through its recent highs and build momentum for a potential look back towards the 0.6400/0.6500 area. The relentless pressure on the USD is providing a tailwind and dips towards 0.6000 should continue to see demand.
- (Bloomberg) -- ANZ Bank New Zealand Chief Economist No longer sees RBNZ cutting cash rate at July 9 decision, predicting instead it will keep the rate at 3.25%
- “From there, we are now forecasting a cautious pace of cutting with 25bp cuts in August and November, with a third 25bp cut in February to 2.50% best interpreted as a placeholder for global headwinds, particularly confidence impacts”
- Q2 NZIER Business Confidence Firms, But Lack Of Demand Cited : "A net 27 percent of firms expect an improvement in general economic conditions over the coming months on a seasonally adjusted basis, which was a further lift from the net 23 percent in the March quarter."
- A huge bounce from sub 0.5900 and the NZD has now established a foothold above 0.6000, with the USD breaking lower the NZD/USD looks to be building for a potential break higher of its own. A clear break of 0.6100 could provide the momentum to begin a larger move higher, initially targeting the 0.6400/0.6500 area.
- CFTC Data shows Asset Managers have cut their shorts and are now beginning to build a long in NZD +12195, the Leveraged community maintained their short that had just been added to -11981.
- Options : Closest significant option expiries for NY cut, based on DTCC data: none. Upcoming Close Strikes : 0.5850(NZD404m July 1), 0.5800(649m July2)
- AUD/NZD range for the session has been 1.0784 - 1.0801, currently trading 1.0790. The cross is struggling to get any momentum for now. It looks to be in a 1.0750 - 1.0850 range for now as it awaits a catalyst to provide some clearer direction.
Fig 1: NZD/USD Spot Weekly Chart
Source: MNI - Market News/Bloomberg Finance L.P