WTI TECHS: (Z5) Trades Through The 50-Day EMA
Oct-24 07:33
- RES 4: $71.47 - High Jun 23 and a key medium-term resistance
- RES 3: $67.68 - High Jul 30
- RES 2: $65.77/68.43 - High Sep 26 and key resistance
- RES 1: $62.34 - High Oct 8
- PRICE: $61.43 @ 08:16 BST Oct 24
- SUP 1: $55.96 - Low Oct 20
- SUP 2: $54.85 - Low May 5
- SUP 3: $54.16 - Low Apr 9 and a key support
- SUP 4: $53.23 - 1.764 proj of the Jul 30 - Aug 13 - Sep 26 price swing
The latest recovery in WTI futures appears corrective for now, however, note that price has traded through resistance at the 50-day EMA, at $61.11. The breach of this average signals scope for a stronger recovery and exposes $62.34 next, the Oct 8 high. Clearance of this level would expose key resistance at $65.77, the Sep 26 high. Key support and the bear trigger has been defined at $55.96, the Low Oct 20.
Want to read more?
Find more articles and bullets on these widgets:
Historical bullets
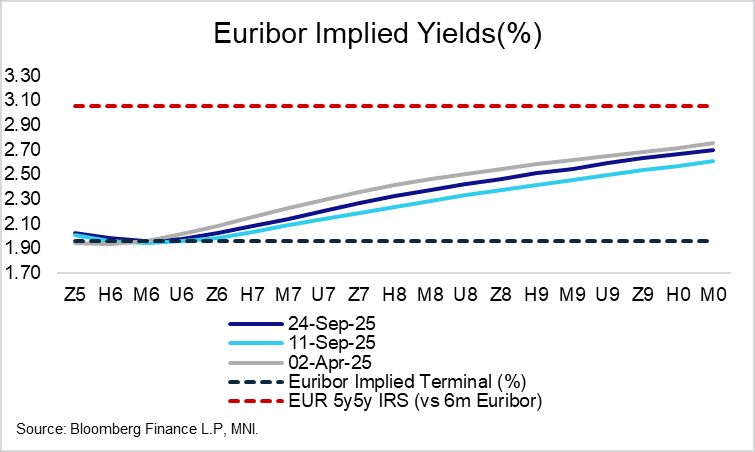
STIR: Euribor Curve Steeper Since Sep Decision As Markets Weigh Future Hike Risk
Sep-24 07:30
- The Euribor curve has gradually steepened since the September decision, with Z6/Z7 up almost 5 ticks to 24 ticks over the past two weeks. With the ECB’s easing cycle likely at (or at least very close to) its end, focus for markets is moving further out the curve, with modest hike premiums being built in.
- The implementation and impact of increased German fiscal spending, alongside the lagged impact of past rate cuts, is expected to support the economic recovery. Key to this recovery will be an increase in household’s propensity to consume from low levels, and the emergence of fiscal multipliers from German defence/infrastructure spending. There is uncertainty with respect to both of these dynamics.
- In the near-term, ECB-dated OIS price 10bps of easing through July 2026, with inflation risks still potentially tilted to the downside in the coming months.
- This morning, ECB’s Cipollone suggested Eurozone inflation risks are “very balanced”. In line with other dovish leaning Governing Council colleagues, he noted that there will be “lots of information” available before the December projection round.
- The German September IFO survey is due at 09003BST, with analysts expecting a modest improvement across components. Yesterday’s composite PMI was stronger-than-expected at 52.4 (vs 50.7 cons, 50.5 prior), driven by the services sector.
| Meeting Date | ESTR ECB-Dated OIS (%) | Difference Vs. Current Effective ESTR Rate (bp) |
| Oct-25 | 1.927 | 0.0 |
| Dec-25 | 1.902 | -2.5 |
| Feb-26 | 1.891 | -3.6 |
| Mar-26 | 1.853 | -7.4 |
| Apr-26 | 1.846 | -8.2 |
| Jun-26 | 1.828 | -9.9 |
| Jul-26 | 1.827 | -10.0 |
| Sep-26 | 1.842 | -8.5 |
| Source: MNI/Bloomberg Finance L.P. | ||
EURIBOR OPTIONS: ERH6 98.25/98.37 Call Spread Lifted
Sep-24 07:22
ERH6 98.25/98.37 call spread paper paid 1 on 2K.
GILTS: Futures Through Resistance
Sep-24 07:19
Gilts rally, playing catch up to the bid in Tsys after UK markets closed yesterday.
- Futures pierce yesterday’s high (91.11), topping out at 91.28, with bulls now looking to the September 11 high (91.82).
- Yields 1.5-3.0bp lower, curve flatter, 2s10s ~5bp off last week’s pullback low, while 5s30s is ~3bp off last week’s base.
- The DMO will come to market with GBP4.75bln of the short 5-year 4.375% Mar-30 gilt this morning.
- We don't think that yesterday's disappointing 30-Year auction will have any impact on this auction and continue to expect strong demand at the offering.
- This is because structural changes and fiscal concerns have a much larger impact on the long-end while the short-end continues to see very strong demand when it comes to primary issuance.
- Elsewhere, the DMO has announced that it will launch a new conventional 31 Jan ’41 gilt via syndication in the week commencing 13 Oct’25, matching our expectations.
- BoE’s Greene will speak on supply shocks and monetary policy this evening (17:30 London).
- SONIA futures now flat to +3.0 given the move further out the curve, with BoE-dated OIS still pricing ~6bp of easing through year-end.