US TSYS: Yields Lower Across Curve; TYH6 Nears Key Tech Level
Bond futures are up modestly across all maturities today in a relatively low volume trading day in Asia. The 10-Yr is up +02 at 112-31 with topside resistance at 113 being the 20-day EMA. Downside resistance in the 50-day EMA is at 112-27, where it failed to trade below in recent falls.
Cash rallied across the curve with yields down across all maturities, with the front end outperforming.
- The 2-Yr is down -1.2bps to 3.50%
- The 5-Yr is down -1.2bps to 3.645%
- The 10-Yr is down -1bps to 4.079%
- The 30-Yr is down -0.9bps to 4.739%
Projected rate cut pricing rises vs. late Monday US time (*): Dec'25 at -24.6bp (-24.7bp), Jan'26 at -31.8bp (-30.6bp), Mar'26 at -39.7bp (-37.8bp), Apr'26 at -46.8bp (-44.1bp).
Wednesday Key Data Calendar: ADP Employment Change, Import/Export Price Index, Industrial Production MoM, S&P Global US Services PMI, ISM Services Index and New orders.
For new issuance, bills remain in focus with a US$75bn 6-week auction
Want to read more?
Find more articles and bullets on these widgets:
Historical bullets
GOLD: Softer USD Helps Gold Recover From China VAT Change Losses
Gold prices dipped to $3962.59/oz early in the APAC session driven by news that China was removing the retail tax exemption on gold but they have since recovered to make a high of $4015.42 supported by a weaker US dollar (BBDXY -0.1%). They are currently up 0.1% to $4005.5.
- China’s retailers will no longer be able to offset VAT on gold sales including bars and jewellery, which is likely to reduce demand through higher prices. The main impact is likely to be on sentiment which has contributed to gold’s major rally in 2025, according to Bloomberg.
- Silver is 0.2% higher at $48.80, close to the intraday peak at $48.911 but holding below initial resistance at $49.456.
- Equities are generally stronger with the S&P e-mini up 0.2% and Hang Seng +0.6%. Oil prices are higher with WTI +0.4% to $61.19/bbl. Copper is flat.
- Later the Fed’s Daly and Cook appear with Cook speaking on the economy and monetary policy. With US data still scarce due to the government lockdown, the October manufacturing PMI & ISM data are likely to be watched closely. European October manufacturing PMIs are also released and the ECB’s Lane speaks.
ASIA STOCKS: KOSP Hits New Highs on Tech Rush
News that Nvidia has signed deals with Korean semi conductor companies like Samsung continue to underpin the rally in the KOSPI that is reaching new levels daily, and looking overbought on many valuation metrics. The rally now is the strongest in more than 20 years as Asia and particularly Korea position themselves in the global tech race. In China, gold related stocks were hit after a tax rebate on gold was ended by the government and could potentially increase costs. With Japan out, it was down to China to lead and despite the KOSPI's rally, China stocks were mixed on the day.
- The Hang Seng and CSI 300 were again going in opposite direction with the HSI up +0.58% and the CSI 300 down -0.45% whilst the Shanghai Comp was close to flat, whilst Shenzhen fell -0.61%
- The KOSPI hit 4,202 to be up +2.25% today to continue its run, now up over 70% YTD.
- The FTSE Malay KLCI has had a quiet period but is up today by +0.58% whilst the JCI in Indonesia is having its best start to a trading week in a fortnight with gains of +1.10%
- The NIFTY 50 posted new highs last week, before fading back and has started the week slowly flat at 25,727.
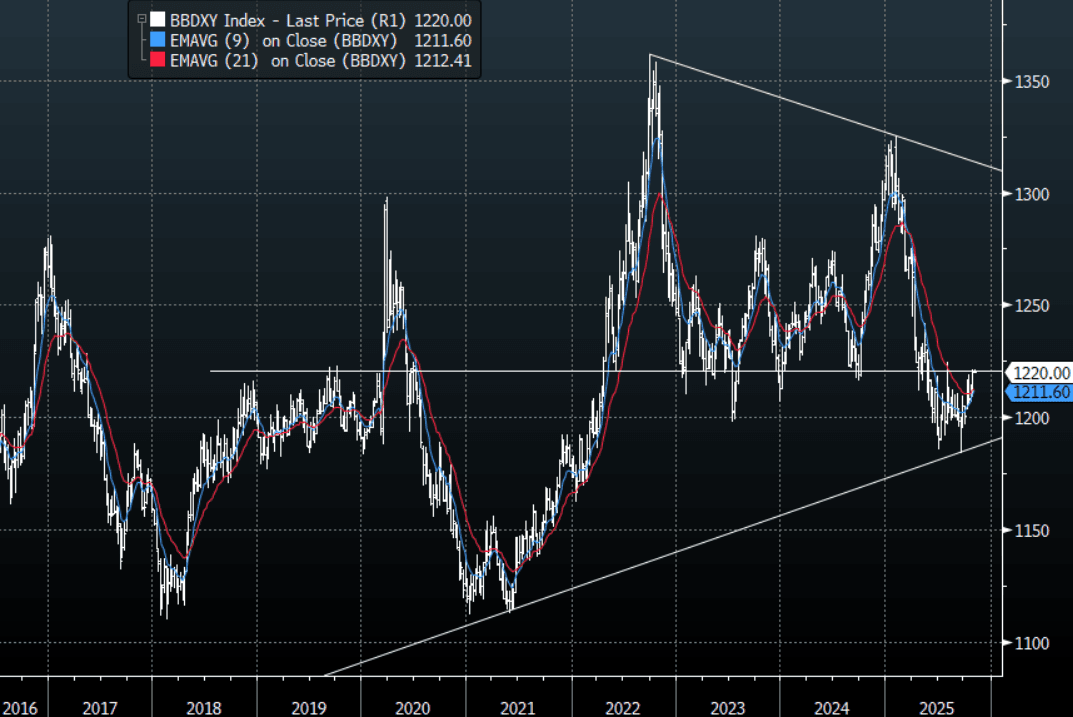
FOREX: Asia-Pac FX - BBDXY Moves Into Pivotal Resistance
The BBDXY has had a range of 1220.25 - 1221.11 in the Asia-Pac session; it is currently trading around 1220, -0.05%. The USD built on its gains from last week into the month-end. The 1220-30 area remains tough resistance, only a sustained close back above 1230 would start to challenge the conviction of the longer-term USD shorts. Risk/Reward does still favour fading this moving initially but the price action is starting to look more constructive as higher lows are being made on the Daily chart through October. A sustained move back above 1230 would potentially signal a medium term low is in place and a deeper pullback is on the cards.
- EUR/USD - Asian range 1.1522 - 1.1538, Asia is currently trading 1.1530. The pair has moved back toward its support just above 1.1500. A break under this support could signal a deeper correction, first target 1.1400 and then the 1.1100/1.1200 area.
- GBP/USD - Asian range 1.3130 - 1.3142, Asia is currently dealing around 1.3140. The pair looks to be building some downward momentum. This 1.3100/1.3150 area has proved to be supportive on more than 1 occasion this year so some work around this level could be expected. I continue to favor fading rallies though as GBP attempts to put in a medium term top.
- USD/CNH - Asian range 7.1178 - 7.1249, the USD/CNY fix printed at 7.0867, Asia is currently dealing around 7.1190. The support below 7.1000 looks to be pretty solid for now as USD/Asia moves in sympathy with a higher USD/JPY. The range of 7.08-7.16 looks set to continue for now.
- Cross asset : SPX +0.15%, Gold $4007, US 10-Year 4.0775%, BBDXY 1220, Crude Oil $61.18
- Data/Events : Italy HCOB Italy Manufacturing PMI/Budget Balance, Germany HCOB Germany Manufacturing PMI, EZ HCOB Eurozone Manufacturing PMI, France HCOB France Manufacturing PMI, Spain HCOB Spain Manufacturing PMI
Fig 1: BBDXY Spot Weekly Chart
Source: MNI - Market News/Bloomberg Finance L.P