COMMODITIES: WTI Futures Narrow Gap to Bull Trigger at $66.48
A bull cycle in WTI futures remains intact. However, the reversal from the Jan 29 high continues to highlight a corrective cycle. Attention is on support at the 20-day EMA, at $62.33. The 50-day EMA lies at $60.63. A clear breach of the 50-day average would highlight a stronger reversal and open $58.53, the Jan 20 low. Key resistance and the bull trigger to watch has been defined at $66.48, the Jan 30 high. The latest bounce in Gold highlights a retracement of the Jan 29 - Feb 2 sell-off. The next two resistance points to monitor are $5139.9 and $5314.0, Fibonacci retracement levels. Note that the sharp sell-off from the Jan 29 high highlights a potential top in the L/T trend and from a S/T perspective, an unwinding of the recent extreme overbought condition. A resumption of bearish activity would refocus attention on $4403.0, the Feb 2 low.
- WTI Crude up $0.9 or +1.41% at $64.85
- Natural Gas up $0 or +0.13% at $3.12
- Gold spot up $44.51 or +0.89% at $5071.67
- Copper up $7.5 or +1.27% at $598.85
- Silver up $4.08 or +5.05% at $84.9387
- Platinum up $91.98 or +4.41% at $2179.76
Want to read more?
Find more articles and bullets on these widgets:
Historical bullets
FOREX: USD Slips as DoJ Targets Powell
- Greenback has stabilised at the session's lower levels, helping keep EURUSD propped toward 1.1700 and GBPUSD above the Friday high of 1.3451. Resultantly, the USD is weaker against all others in G10. The sustainability, and potential extension, of this USD weakness will take the lead from the US curve - which trades bear steeper so far Monday. Following Powell's video statement, it seems Trump's next comments on the topic are the primary market risk - even as the President denied knowledge of the filings over the weekend.
- The primary beneficiaries have been CHF and EUR as today's move slows, but only partially reverses, the YTD rally in USDCHF and YTD weakness in EURUSD. EUR's growing status as a haven is clear in the today's market reaction - and this will likely remain the case through near-term periods of market fragility, even as the outside pricing of ECB hikes further out the curve has faded.
- Despite the broad USD weakness, JPY has failed to receive a meaningful boost to start the week, with a brief flurry down to 157.52 well supported during APAC hours. Domestic factors are certainly playing their part here, as Friday’s reports of PM Takaichi dissolving the Lower House and associated speculation that she could call for a snap election continues to rise. The Yomiuri newspaper has reported that Feb. 8 or Feb. 15 are likely dates for this to occur.
- Technically, last week’s breach of 157.89 for USDJPY was a meaningful development, confirming a resumption of the medium-term uptrend. The next significant topside target will be 158.87, last year’s high and a key resistance. Support to watch lies much lower down at 155.35, the 50-day EMA.
- Typically for a Monday, there are no major data releases scheduled. This should keep focus on any potential comments concerning the Fed's subpoenas from Trump. The President is due at several public events later today, and also holds a call with the Mexican President. Central bank speak today includes Fed's Bostic, Barkin & Williams as well as ECB's Villeroy.
EGBS: Bunds Outperform Treasuries Amid Fresh Fed Independence Concerns
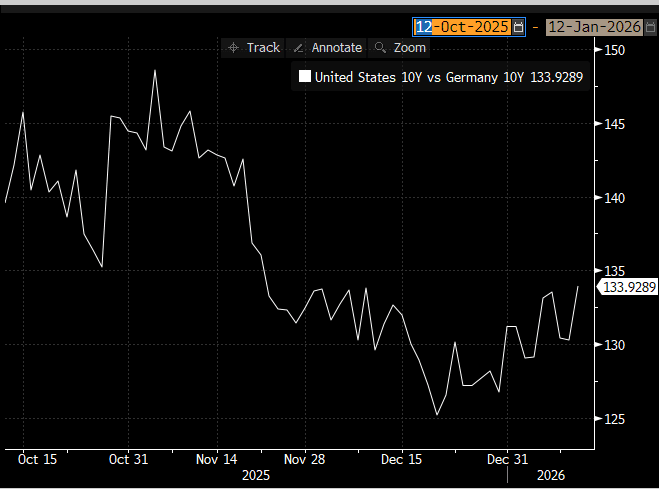
The German curve outperforms its US counterpart, with renewed concerns around Fed independence not spilling over into EGB markets. German yields are up to 1bp lower across the curve, with US yields flat to +5bps in a bear steepening move. The 10-year UST/Bund spread is 3.5bps wider at 134bps.
- Bund futures are unchanged at 127.95. The rally since last Monday does undermine the bear theme and attention is on resistance around the 50-day EMA, at 128.29. A clear break of this average would highlight a stronger reversal and signal scope for a continuation higher.
- The EFSF is holding a dual tranche syndication, launching a new 3- and 10-year bond. We expect a E5-7bln size.
- 10-year EGB spreads to Bunds are biased up to 0.5bps wider. Focus in France remains on budget negotiations, with scope for compromises seeming increasingly slim.
- Regional news flow hasn’t been too market moving. China and the EU have agreed on the need to provide guidance on price commitments for Chinese exporters of pure electric vehicles to the EU.
- Meanwhile, ECB’s Muller pushed back on near-term rate moves in either direction. In line with market pricing, he suggested a rate hike is possible “a few years ahead”.
- The Eurozone Sentix survey was stronger-than-expected at -1.8 (vs -5.0 cons, -6.2 prior).
Figure 1: 10-year UST/Bund Spread (Source: Bloomberg Finance L.P)
OPTIONS: Expiries for Jan12 NY cut 1000ET (Source DTCC)
- EUR/USD: $1.1620(E625mln), $1.1630-50(E2.5bln), $1.1680(E536mln), $1.1800(E1.3bln)
- USD/JPY: Y157.00($848mln), Y157.85-00($1.5bln)
- AUD/USD: $0.6580(A$579mln), $0.6725(A$598mln)
- USD/CNY: Cny7.2000($547mln)