POLAND: Wibor Rates
Sep-14 09:01
| Wibor Today's Rate (%) | (1D change) | |
| 1M | 6.99 | (4 bps) |
| 3M | 7.15 | (0 bps) |
| 6M | 7.32 | (0 bps) |
Want to read more?
Find more articles and bullets on these widgets:
Historical bullets
EGB OPTIONS: Bobl downside
Aug-15 08:57
OEV2 126/125.5ps vs 128/128.75cs, bought the ps for flat in 2k
CROSS ASSET: Disappointing China Data May Weigh On Broader Risk Rebound
Aug-15 08:46
Today's disappointing China activity data, which was weaker across the board, casts somewhat of a shadow over the broader risk outlook, at least if 2022 correlations continue to hold firm.
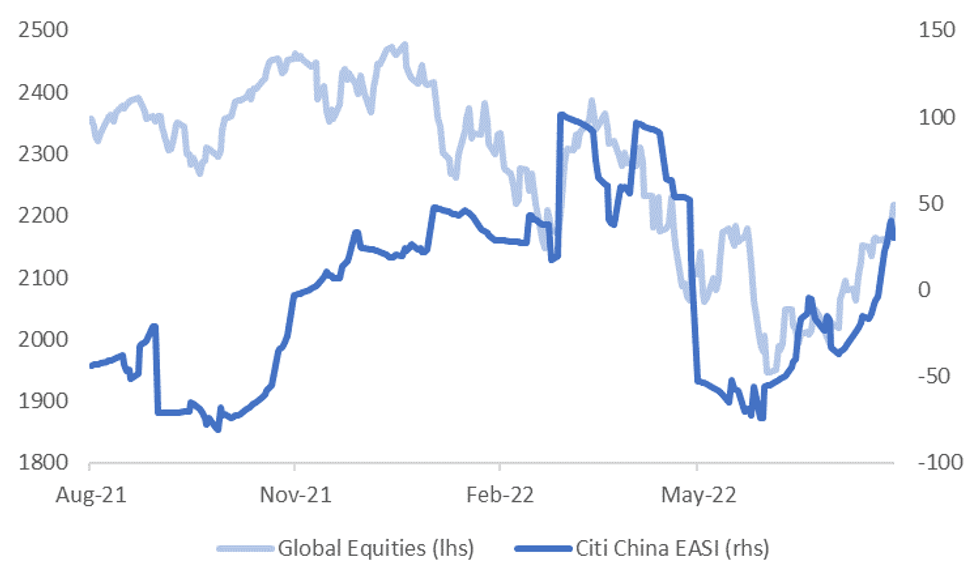
- The first chart below plots the Citi China EASI against global equities. The correlation has been stronger between the two series in 2022. This is likely to reflect the concern around the broader global growth backdrop, particularly as monetary policy started to normalize in major developed economies.
- Today's data outcomes in China are likely to weigh on the EASI levels, which has generally been on an uptrend in recent months. On-going covid related restrictions, with current case numbers at multi-month highs, which may continue to weigh on the domestic demand recovery.
Fig 1: Citi China EASI & Global Equities
 Source: Citi, MNI/Market News/Bloomberg
- The table below presents the correlations for Citi China EASI against global equities and other key macro variables for 2022. For comparison’s sake with have included the equivalent correlations with the US and EU EASIs.
- The China EASI correlation is the same as the US EASI with respect to global equities and slightly higher compared to the EU EASI. Note in 2021 the China EASI correlation with global equities was -35%.
- In terms of other macro variables, the China EASI has had a flat correlation with global commodities, which perhaps owes to supply issues being a greater driver than the demand backdrop.
- The correlation with base metals is firmer though and not surprisingly inversely related with the USD. Interestingly though, the same applies for the US EASI. The EU EASI has the largest negative correlation with broader USD FX performance.
- In any event, renewed concerns around the China growth backdrop are something to be mindful of in terms of expecting a continuation of the risk rally that has unfolded in recent months.
Table 1: Citi EASI Correlations With Major Macro Variables
| Country EASI | |||
| Macro Indicator | China | US | EU |
| Global Equities | 0.65 | 0.64 | 0.54 |
| Global Commodities | -0.04 | 0.27 | 0.16 |
| Base Metals | 0.61 | 0.61 | 0.74 |
| DXY | -0.51 | -0.58 | -0.78 |
| USD NEER | -0.55 | -0.64 | -0.78 |
Source: Citi, MNI/Market News/Bloomberg
USD: Quick tech
Aug-15 08:45
- EURUSD push lower, now eye the August 10 low at 1.0202.
- Cable sees the 10th Aug low at 1.2063, will be initial small support.