NORWAY: Weaker Than Expected Q3 Mainland GDP Will Feed Into Dec Rate Path
Norwegian Q3 mainland GDP was weaker than expected. All else equal, this will have a dovish impact on the domestic demand component of the December MPR rate path. A cut in December still seems unlikely, particularly after the higher-than-expected October inflation report, but the pace and magnitude of easing next year remains uncertain. Upcoming labour market data, the November inflation report and the Q4 Regional Network Survey are the last key inputs to monitor before the December 18 decision.
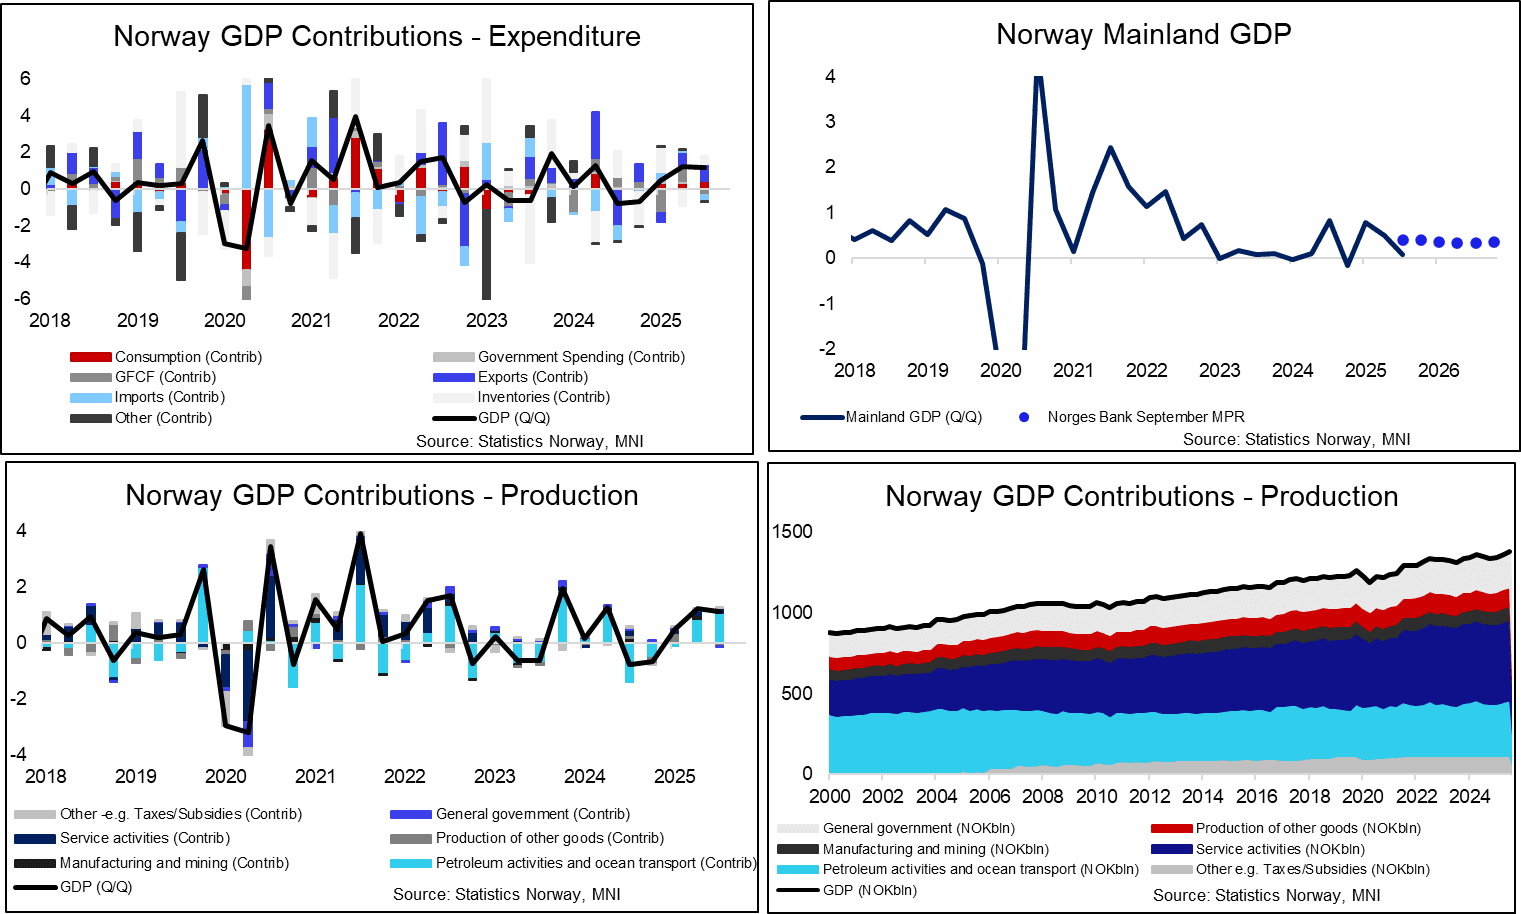
- Q3 mainland GDP was 0.1% Q/Q, below consensus of 0.2% and Norges Bank’s September MPR projection of 0.4%. Q2 was also revised down a tenth to 0.5%.
- Household consumption was the main upward contributor in Q3, rising 1.1% Q/Q (vs 0.8% prior, 1.0% Norges Bank). A pullback in goods consumption (1.3% Q/Q vs 2.4% prior) was offset by a rise in services (0.4% vs 0.1% prior). Statistics Norway highlights that electricity consumption played a large role: "Excluding electricity and consumption abroad, growth in household consumption would have been 0.5 percent, driven by, among other things, consumption of clothing, footwear and furniture".
- Government consumption fell 0.1% Q/Q (vs +0.4% prior) while public investment fell 4.1% Q/Q (vs +0.6% prior). Overall, the 0.8% Q/Q fall in public demand was well below Norges Bank’s expected 1.1% increase.
- Mainland investment developments were soft on a sequential basis but generally better than Norges Bank forecasts: Residential investment was flat (vs 4.6% prior, 0.1% Norges Bank) and business investment fell 0.7% Q/Q (vs +0.1% prior, -1.5% Norges Bank).
- Mainland exports and imports were both stronger than expected by Norges Bank, the former despite a 3.9% pullback in services exports (vs 0.4% prior).
- Headline GDP rose 1.1% Q/Q (vs 1.2% prior) with petroleum investments falling 0.7% Q/Q (vs +12.5% prior, -2.2% Norges Bank) and oil/gas exports rising 3.9% Q/Q (vs 3.7% prior).
Want to read more?
Find more articles and bullets on these widgets:
Historical bullets
EQUITY TECHS: E-MINI S&P: (Z5) Starts The Week On A Bullish Note
- RES 4: 6953.25 2.000 proj of the Aug 1 - 15 - 20 price swing
- RES 3: 6912.25 3.000 proj of the Aug 20 - 28 - Sep 2 price swing
- RES 2: 6900.00 Round number resistance
- RES 1: 6890.00 1.764 proj of the Aug 1 - 15 - 20 price swing
- PRICE: 6887.25 @ 07:23 GMT Oct 27
- SUP 1: 6812.25/6731.66 High Oct 9 / 20-day EMA
- SUP 2: 6645.22 50-day EMA
- SUP 3: 6540.25 Low Oct 10 and a key short-term support
- SUP 4: 6506.50 Low Sep 5
The trend condition in S&P E-Minis remains bullish and the contract is trading higher today, as it begins the week on a bullish note. The fresh cycle high confirms a resumption of the primary uptrend and maintains the bullish price sequence of higher highs and higher lows. Sights are on 6850.87, a Fibonacci projection. Initial support to watch lies at 6721.62, the 20-day EMA. The 50–day EMA is at 6637.80.
SWEDEN: Lending Growth Cotninues To Expand Steadily
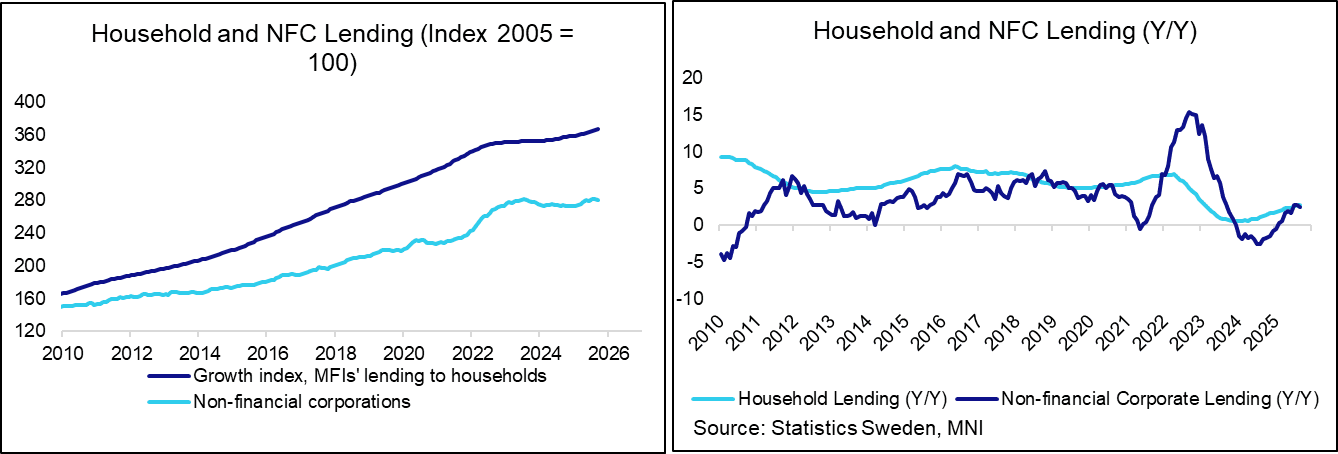
Swedish non-financial corporation lending growth eased three tenths to 2.5% Y/Y in September, but remains comfortably above the H1 average growth rate of 0.95%. The continued passthrough of easier monetary policy should continue to support business lending growth in the coming months. The 2010-2019 average monthly growth rate was 3.5% Y/Y. Household lending (the majority of which is mortgage lending) ticked up another tenth to 2.8% Y/Y (vs 1.8% at the start of this year).
- Around 70% of Swedish household mortgages are floating rate, so interest rate changes feed through to the real economy relatively quickly. In September, the average rate paid on floating rate mortgages fell to 2.80% (vs 2.86% prior), the lowest since August 2022.
- The Riksbank is expected to remain on hold at 1.75% for some time to come.
- This week's calendar includes plenty of growth data. The Riksbank (and the Government) will want to start seeing evidence of a recovery taking hold.
WTI TECHS: (Z5) Has Breached The 50-Day EMA
- RES 4: $71.47 - High Jun 23 and a key medium-term resistance
- RES 3: $67.68 - High Jul 30
- RES 2: $65.77/68.43 - High Sep 26 and key resistance
- RES 1: $62.59 - High Oct 24
- PRICE: $61.55 @ 07:17 GMT Oct 27
- SUP 1: $59.64/55.96 - Low Oct 23 / 20
- SUP 2: $54.85 - Low May 5
- SUP 3: $54.16 - Low Apr 9 and a key support
- SUP 4: $53.23 - 1.764 proj of the Jul 30 - Aug 13 - Sep 26 price swing
The latest recovery in WTI futures appears corrective for now, however, note that price has traded through resistance at the 50-day EMA, at $61.13. The breach of this average signals scope for a stronger recovery . A resistance at $62.34, the Oct 8 high, has been pierced. A clear breach of this level would expose key resistance at $65.77, the Sep 26 high. Key support and the bear trigger has been defined at $55.96, the Low Oct 20.