JPY: USD/JPY Grinds Away From Multi-Week Lows
USD/JPY stabilises after a spectacular collapse over the final two sessions of last week, as the moderation in Fed rate hike bets tested the limits of shorting the yen.
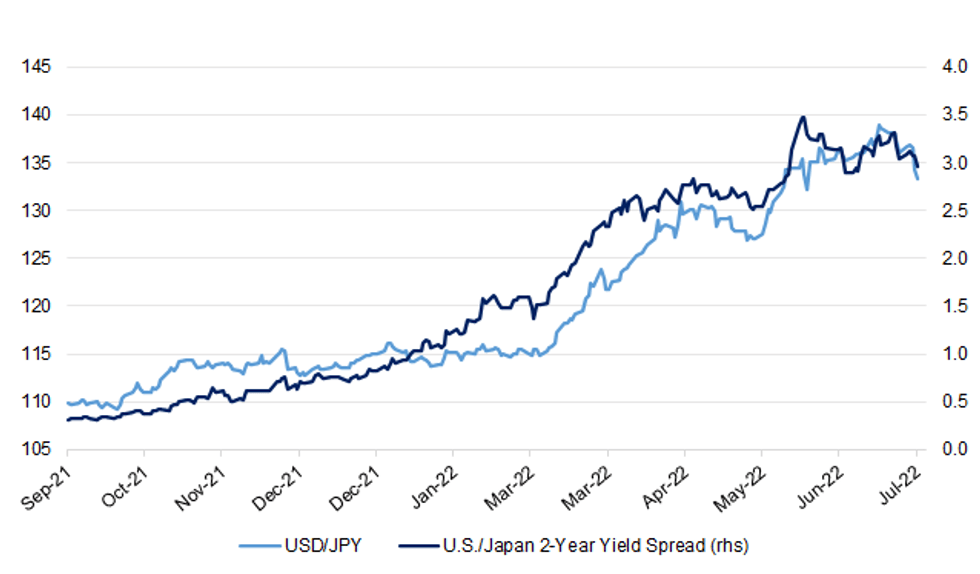
- U.S./Japan yield spreads have shrunk over the past few weeks. 10-year yield gap was 246bp come the end of play last Friday, while 2-year spread was 296bp.
- Spot USD/JPY tumbled through its 50-DMA and closed below there for the first time since March, plumbing multi-week lows in the process.
- The rate has added 24 pips so far to last trade at Y133.51 as the greenback has found poise. E-minis trade in the red but Nikkei 225 futures point to a higher re-open.
- From a technical standpoint, bulls need a clearance of Jul 27 high of Y137.46 before targeting Jul 21 high of Y138.88. Conversely, bearish focus falls on key support from Jun 16 low of Y131.50.
- The subcommittee of Japan's Central Minimum Wage Council is planning to recommend raising the nationwide average minimum wage by Y30/hour or more, Mainichi reported. This would represent the largest minimum wage hike ever.
- Final Jibun Bank M'fing PMI headlines the domestic data docket today. Looking further afield, household spending/earnings data will be out on Friday.
Fig. 1: USD/JPY vs. U.S./Japan 2-Year Yield
 Source: MNI - Market News/Bloomberg
Want to read more?
Find more articles and bullets on these widgets:
Historical bullets
JGB TECHS: (U2) Solid Bounce Into the Close
- RES 3: 151.13 - High Mar 3
- RES 2: 150.44 - High Mar 14
- RES 1: 150.14 - High Apr 1 and key resistance
- PRICE: 149.30 @ 16:43 BST Jul 1
- SUP 1: 147.15 - Low Jun 14
- SUP 2: 147.08 - 3.0% Lower Bollinger Band
- SUP 3: 146.82 - Low Jul 14 2015
JGBs extended the near-term corrective bounce into the Friday close, persisting with the recovery off last week’s lows. The broader outlook, however, remains negative after JGB futures showed below the 1.0% 10-dma envelope for the first time since the depths of the COVID-19 crisis, touching 147.15 on the pull lower. The next downside level crosses at 147.08, the 3.0% lower Bollinger Band ahead of 146.82 - the low from July 14th 2015.
USDCAD TECHS: Bullish Price Structure
- RES 4: 1.3192 1.00 proj of the Apr 5 - May 12 - Jun 8 price swing
- RES 3: 1.3113 High Nov 23 2020
- RES 2: 1.3079 High May 17 and a bull trigger
- RES 1: 1.3017 High Jun 23
- PRICE: 1.2918 @ 16:59 BST Jul 1
- SUP 1: 1.2819/2807 Low Jun 28 / 50-day EMA
- SUP 2: 1.2732 61.8% retracement of the Jun 8 - 17 rally
- SUP 3: 1.2681 Low Jun 10
- SUP 4: 1.2518 Low Jun 8 and key support
USDCAD outlook remains bullish and the pair is trading above this week’s low. The recent corrective cycle appears to have stalled at Tuesday’s low of 1.2819. Looking at Japanese candle patterns, Tuesday is a doji pattern and this points to a short-term bullish reversal. A stronger recovery would refocus attention on resistance at 1.3079 the Jun 17 and a bull trigger. Firm support lies at 1.2807, the 50-day EMA.
AUDUSD TECHS: Clears Key Support
- RES 4: 0.7202 High Jun 9
- RES 3: 0.7138 High Jun 10
- RES 2: 0.7069 High Jun 16 and a key short-term resistance
- RES 1: 0.6979 20-day EMA
- PRICE: 0.6794 @ 16:56 BST Jul 1
- SUP 1: 0.6764 Low Jul 1
- SUP 2: 0.6759, 50.0% retracement of the Mar ‘20 - Feb ‘ 21 bull cycle
- SUP 3: 0.6685 High Mar 9 2020
- SUP 4: 0.6647 0.764 proj of the Apr 5 - May 12 - Jun 3 price swing
AUDUSD is softer and the pair has traded below its key short-term support at 0.6829, the May 12 low. The break of this support confirms a resumption of the downtrend that started in February 2021 and maintains a broader bearish price sequence of lower lows and lower highs. The move lower signals scope for weakness towards 0.6759, the 50.0% retracement of the Mar ‘20 - Feb ‘ 21 bull cycle.