CNH: Back To Outperforming On Global Recession Fears?
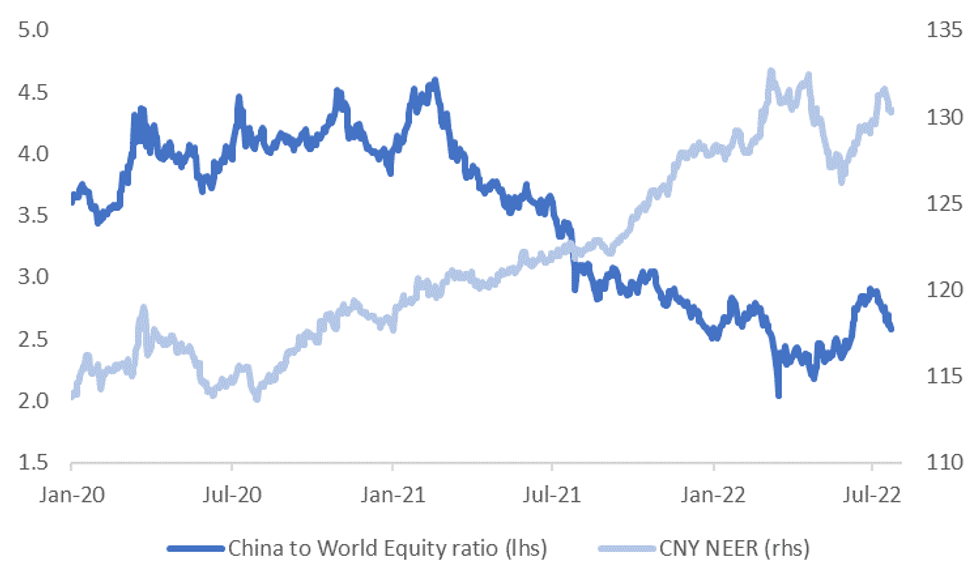
The CNY NEER has fallen just over 1% from its recent peak. The first chart below plots the CNY NEER and the ratio of China equity performance to global equity performance. Through much of July China equities have unperformed the rest of the world trend. This also caught up with CNY FX performance. As we outline below though, these relative trends could start to stabilize reverse somewhat.
Fig 1: CNY NEER & China Relative Equity Market Performance
 Source: MNI - Market News/Bloomberg
- If recessionary fears become a dominant theme in global markets there is certainly scope for these underperformance trends, in terms of relative China asset performance, to stabilize/reverse somewhat.
- To be sure, there are certainly clouds over the China growth outlook given the continued dynamic covid zero strategy. There is also concern around the housing sector, particularly in relation to mortgage repayments.
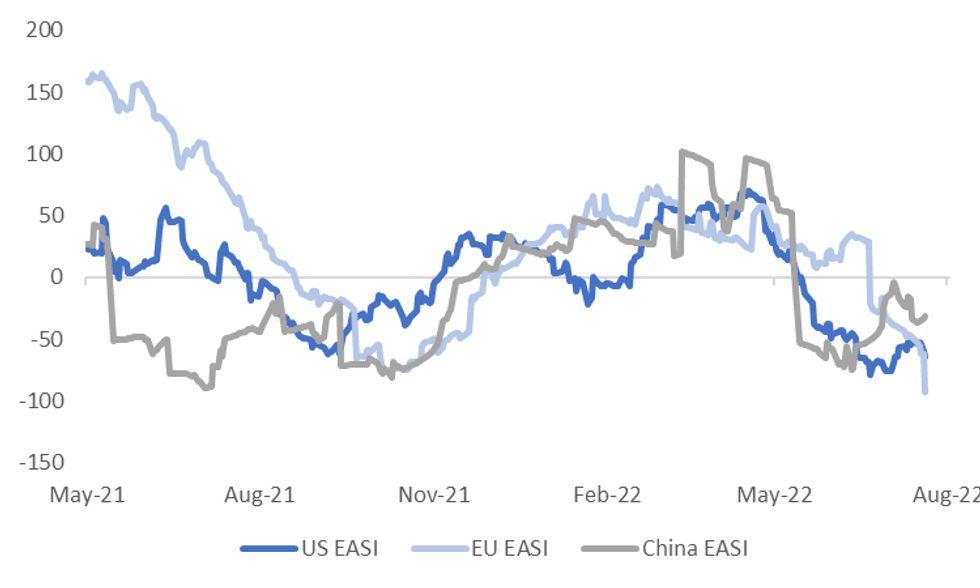
- Still, data momentum is moderating faster in the EU and US, at least according to Citi EASIs, see the see second chart below. At the margin, stimulus efforts in China could help as well, notwithstanding the challenges outlined above.
- If such trends continue, CNH may outperform in the FX space against higher beta plays and the EUR. Performance against the JPY is less clear given its historical outperformance during global recessionary periods.
- This Sunday's China PMI prints will be the next key update in terms of relative data trends. The market is forecasting resilient outcomes at this stage (manufacturing at 50.4 versus 50.2 in June, 53.9 for non-manufacturing versus 54.7 last month), particularly relative to the EU and US trends from late last week.
Fig 2: Relative Citi EASIs
 Source: Citi/MNI - Market News/Bloomberg
Want to read more?
Find more articles and bullets on these widgets:
Historical bullets
MNI: Test, Please Ignore
Test Please Ignore
AUSSIE 10-YEAR TECHS: (U2) More Stable But Still Fragile
- RES 3: 97.455 - High Mar 18
- RES 2: 97.185 - High Apr 5
- RES 1: 96.945 - High Apr 26 and key short-term resistance
- PRICE: 96.220 @ 15:36 BST Jun 24
- SUP 1: 95.663 - Low Jun 16
- SUP 2: 95.470 - 3.0% Lower Bollinger Band
- SUP 3: 95.651 - 0.5% 10-dma envelope
Aussie 10yr futures have strengthened, but remain weak over the medium-term, having extended the downtick alongside the global wave of bond weakness. This shifts first support lower, with markets eyeing vol band support at both 95.470 and 95.651. Moving average studies continue to highlight a bearish backdrop and recent weakness has maintained a bearish price sequence of lower lows and lower highs - the definition of a downtrend. Key short-term resistance remains at 96.945, the Apr 26 high.
USDCAD TECHS: Trend Structure Remains Bullish
- RES 4: 1.3338 38.2% of the 2020 - 2021 bear leg
- RES 3: 1.3192 1.00 proj of the Apr 5 - May 12 - Jun 8 price swing
- RES 2: 1.3113 High Nov 23 2020
- RES 1: 1.3079 High May 17 and a bull trigger
- PRICE: 1.2911 @ 15:52 BST Jun 24
- SUP 1: 1.2906 Low Jun 21
- SUP 2: 1.2861/53 Low Jun 16 / 20-day EMA
- SUP 3: 1.2791 50-day EMA
- SUP 4: 1.2681 Low Jun 10
The USDCAD outlook is bullish and price continues to trade closer to its recent highs. The pair cleared 1.3000 on Jun 17 and the rally also resulted in a print above key resistance at 1.3077, the May 16 high and a bull trigger. A clear breach of 1.3077 would confirm a resumption of the uptrend and signal scope for strength towards 1.3113, the Nov 23 2020 high. Initial firm support is at 1.2853, the 20-day EMA.