FOREX: USD - BBDXY Move Lower Stalls Below 1200 As Peace Talks Loom
The BBDXY has had a range today of 1199.56 - 1200.89 in the Asia-Pac session; it is currently trading around 1200. The USD continues to find demand just below 1198 ahead of the weekend talks. The price action continues to highlight how bearish the market is on the USD and are very quickly to re-enter the trade. The USD bears will probably hold off trying to add to their positions until we hear news out of the talks this weekend, this leaves us probably chopping around in no-man's land until then. On the day, I suspect a rally back towards 1205-1208 could now find sellers initially and we will probably trade 1195-1210 until we get some clarity. I continue to see the two countries' objectives for these talks to be poles apart and unless there is some serious coercion from China I struggle to see how a deal is made. The market prefers to have a more positive take with some like Robin Brooks believing the pressure from US midterms will be enough to get a deal done, let's see how this weekend plays out.
- EUR/USD - Asian range 1.1686-1.1704, Asia is currently trading 1.1695. The pair topped out again above 1.1700 overnight as the market looks toward the weekend peace talks for direction. The market's optimism for a deal should keep the EUR supported for now on dips, let's see what the outcome brings us. On the day, I suspect the market will chop around into the weekend, with participants loathe to add any fresh risk until we get clues as to the possibility of a clear resolution and what it looks like. So a wide and choppy 1.1600-1.1800 should cover it.
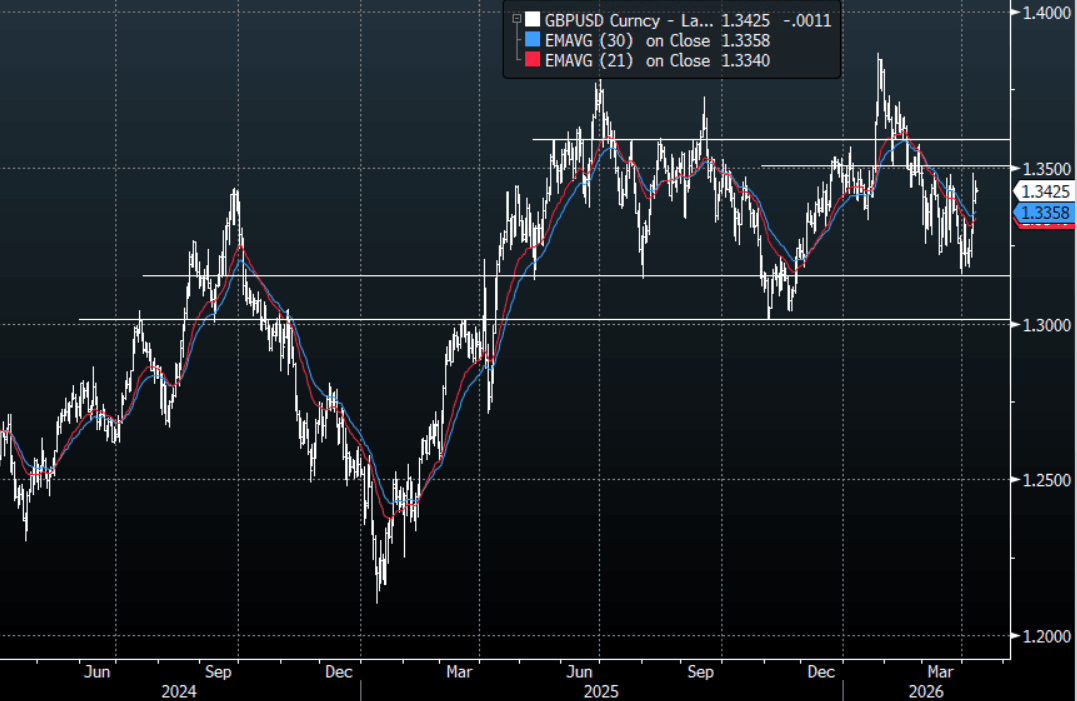
- GBP/USD - Asian range 1.3420-1.3437, Asia is currently dealing around 1.3425. The pair’s move higher continues to stall just ahead of 1.3500 for now. On the day, the pair remains within its recent 1.3200-1.3500 range with the bears hoping the 1.3500-13600 area holds or we could see some further paring back of shorts and the potential medium top would fade into memory.
- Data: ECB’s Guindos Speaks, US March CPI, US April University of Michigan Sentiment
Fig 1: GBP/USD Spot Daily Chart
Source: MNI - Market News/Bloomberg Finance L.P
Want to read more?
Find more articles and bullets on these widgets:
Historical bullets
AUSSIE BONDS: Subdued Session Despite Lifting Chances Of A March Hike
ACGBs (YM +1.0 & XM -0.5) are little changed after a relatively subdued data-light session. The market’s attention continues to focus on the US/Iran conflict and its resultant impact on the price of oil.
- The WSJ reported that the IEA has proposed the largest release of oil reserves in its history to bring down crude prices that have soared during the U.S.-Israel war with Iran.
- Cash US tsys are 1-2bps richer in today's Asia-Pac session after yesterday's bear-steepener.
- Cash ACGBs are little changed with the AU-US 10-year yield differential at +71bps.
- Ahead of next Tuesday’s RBA meeting, Deputy Governor Hauser said yesterday further inflationary pressure from the war in Iran would be unhelpful. Hauser stated that inflation is headed "higher than the projection we published in February" and that it's "so important actually that we do take the steps needed to bring inflation back to target from its too high level at the moment".”
- The bills strip has twist-flattened, with pricing -7 to +4 across contracts.
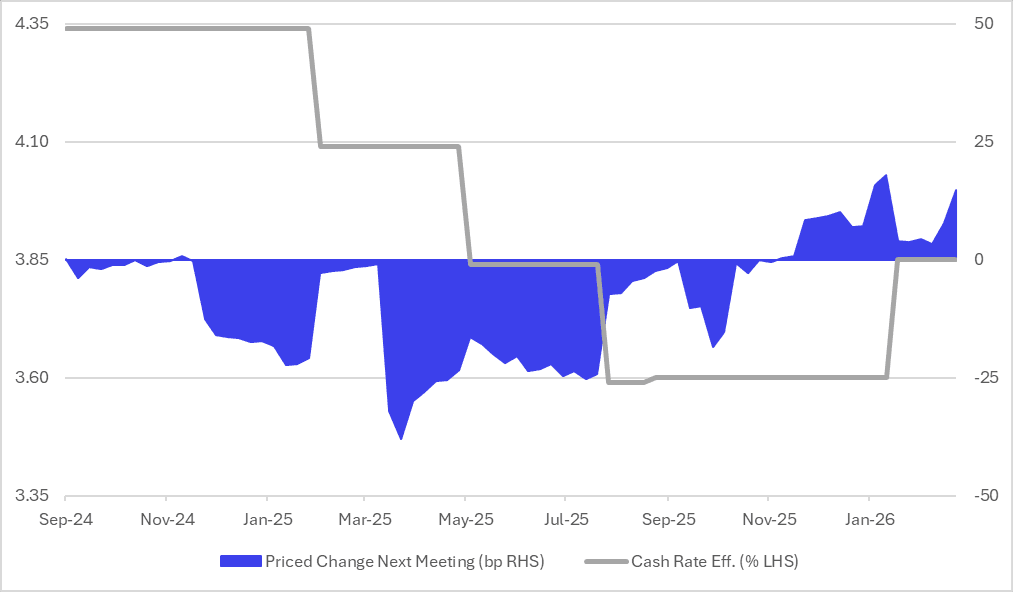
- RBA-dated OIS pricing has firmed sharply, with the probability of a 25bp hike rising from 69% for March to 155% by June and 244% by December 2026.
- Tomorrow, the local calendar will see Consumer Inflation Expectations.
Bloomberg Finance LP
GOLD: US FEB CPI Sidelined as Markets Signal Inflationary Build Up
- During the Asian trading session gained for a second day, trading narrowly around the $5,190 – $5,210 range.
- Prices successfully retook the US$5,200 psychological level as investors awaited the release of critical US Consumer Price Index (CPI) data.
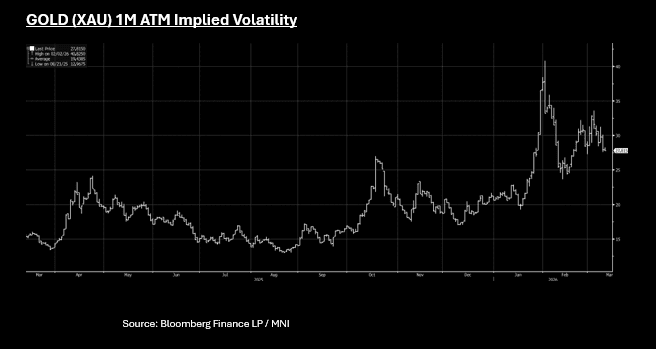
- 1M ATM Volatility has declined from the March highs though at 27 remains significantly above the 1-Yr and 5-Yr averages of 19.43 and 15.09 respectively. Short term momentum indicators for Gold VOL point to ongoing moderation.
- The release of February's U.S. CPI data on March 11. Economists expect inflation to remain relatively steady compared to January's cooler-than-anticipated figures with headline CPI YoY forecast at +2.4% (prior +2.4%); CPI MoM expected to rise 0.3% (+0.2% prior) and Core CPI YoY forecast to hold steady at +2.5%.
- With the rise in oil prices in recent weeks, inflation expectations have repriced bond markets with the June FED meeting now only pricing in 29% probability of a cut and July 27%. July at its peak had a 71% probability of a cut.
- Whilst a very weak CPI print may bring forward rate cut expectations (and boost gold), in the current environment the February CPI is likely to be viewed as stale given expectations for sharp rise in inflation going forward on the back of oil's ascent.
- Look for gold to tread water in the near term, dictated by USD moves. Medium term however will depend on whether we face a stagflation environment, which is typically good for gold.
ASIA STOCKS: Outflow Momentum To Date Above Previous Cycle Lows, Ex South Korea
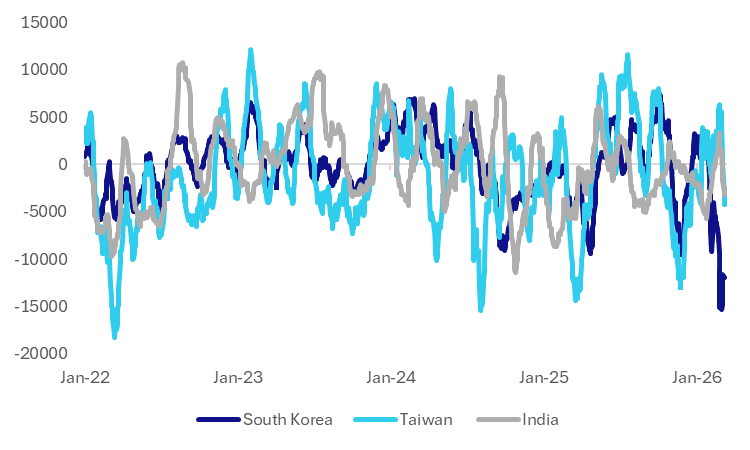
The charts below plot the rolling 1 month sum of Asian offshore net equity flows. The first chart is for South Korea, Taiwan and India (3 of the larger markets in the region). Momentum has clearly rolled over in all three markets, particularly since the onset of the Iran conflict. For Taiwan and India outflow momentum is above recent cycle lows though. In 2022 (the last big negative terms of trade shock), we saw very strong outflow pressures in Taiwan. In contrast, South Korean outflow pressures have been much stronger, compared to previous cycles. This may have reflected outflow pressures emerging earlier in South Korea (late Jan/early Feb), which was likely reflective of paring of risk in South Korean stocks amidst a very strong rally over the prior 12 months.
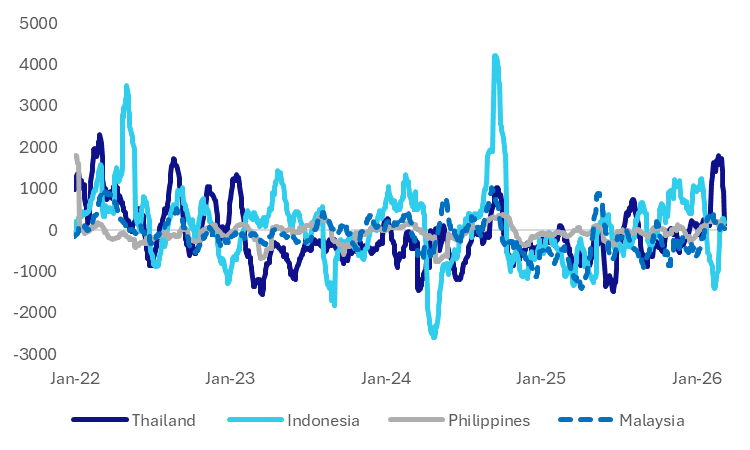
- It is a similar story in some of the South East Asian markets, see the second chart below. There are idiosyncratic stories as well, like Indonesia, which saw earlier outflow momentum amid local market pressure (amidst downgrade fears), while in Thailand inflow momentum improved on growth prospects amid a strong election result earlier in the year.
- Inflow momentum is now reversing from Thailand, while Indonesia's flow picture may had been more adverse in recent weeks, if it weren't for prior outflow pressures.
Fig 1: South Korea, Taiwan & Indian Net Equity Flows - Rolling 1 mth Sum (USD Mn)
Source: Bloomberg Finance L.P./MNI
Fig 2: Thailand, Indonesia, Malaysia & Philippines Net Equity Flows - Rolling 1 mth Sum (USD Mn)
Source: Bloomberg Finance L.P./MNI


